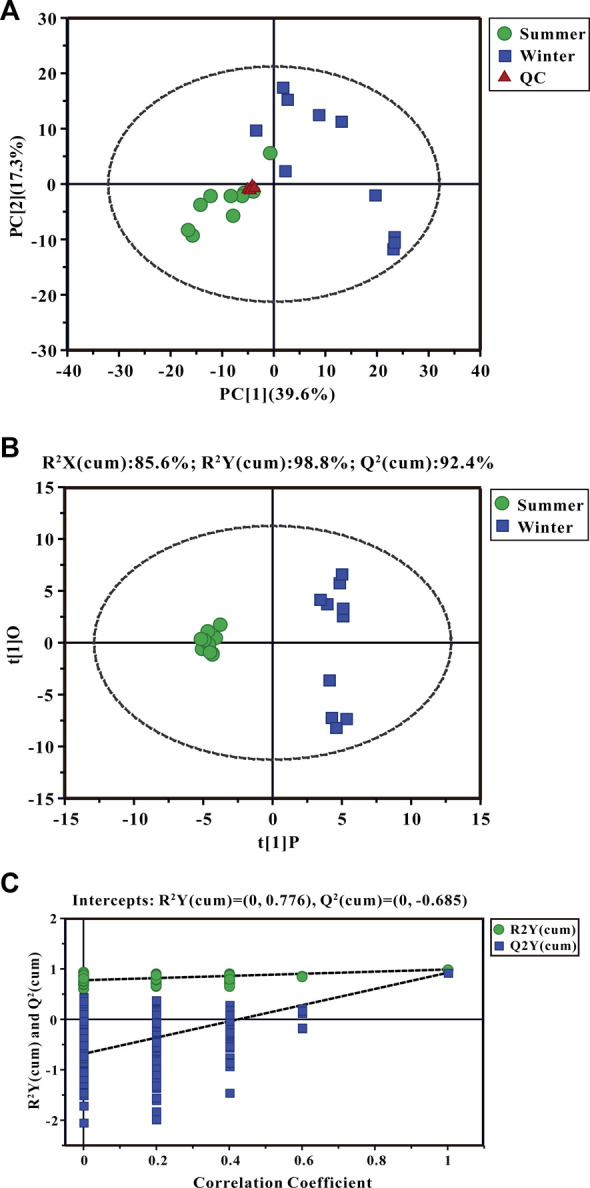
FIGURE 3.

Principal component analysis (PCA) score plots (A), the orthogonal projection to latent structures discriminant analysis (OPLS-DA) scores plots (B), and permutation tests (C) for liver metabolites. Three groups are distinguished: summer-collected frogs, green; winter-collected frogs, blue; and Quality Control (QC) samples, red.
