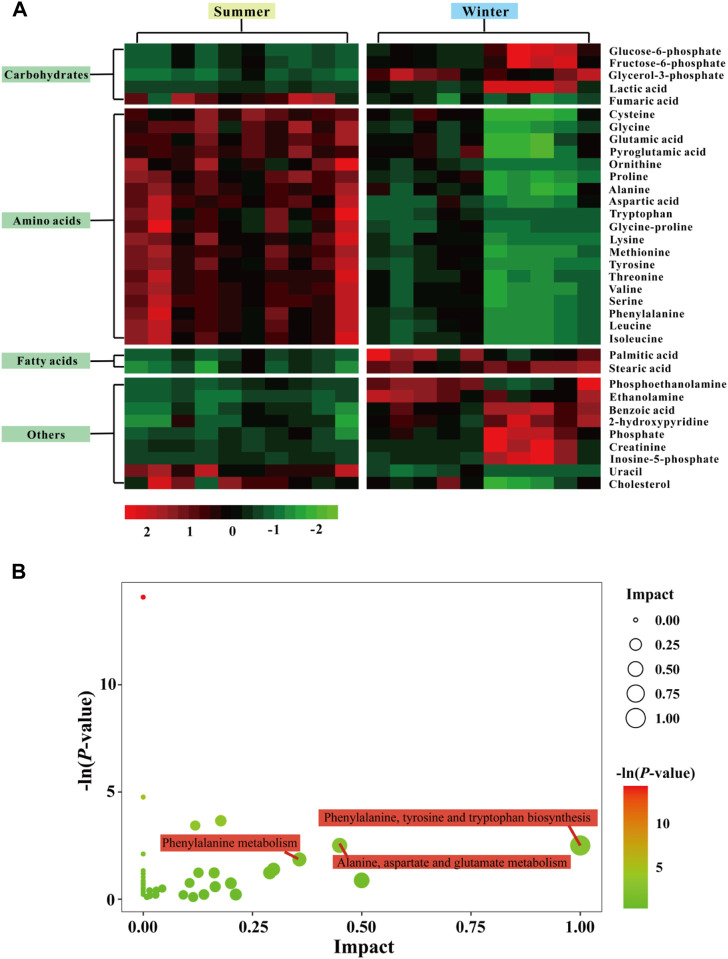
FIGURE 4.
Heat map of identified differentially expressed metabolites in the liver from summer- and winter-collected N. parkeri (A). The impact score (0,1) indicates the pathway topological importance of the metabolites. The color and size of each circle is based on p values and pathway impact values, respectively. Pathway analysis of differential metabolites in liver (B); red color indicates highly expressed metabolites, and green indicates low expressed metabolites.

