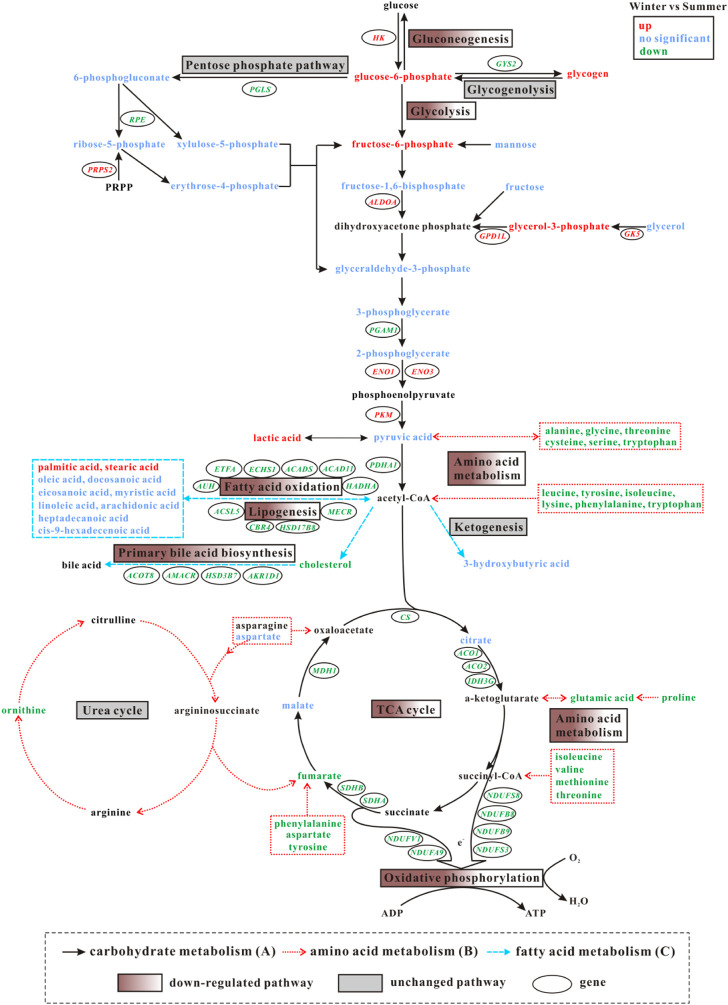
FIGURE 5.
Primary changes in gene expression and metabolites in pathways participating in energy metabolism in liver of N. parkeri between the two seasons (winter vs. summer): carbohydrate metabolism (A), amino acid metabolism (B), fatty acid metabolism (C). Red color indicates up-regulated genes and metabolites, green indicates down-regulated genes and metabolites, and blue indicates no significant change in metabolite level.

