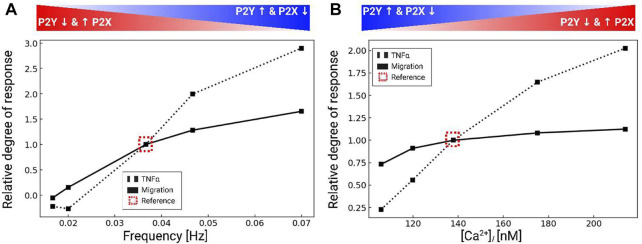
FIGURE 6.
Predicted TNFα production (black dashed) and migration (black solid), normalized to control conditions (dashed box) in response to variations of the intracellular Ca2+ waveform frequency (A) and amplitude (B). All calculations were performed using 200 µM ATP and the data were collected over 5 min after ATP addition.

