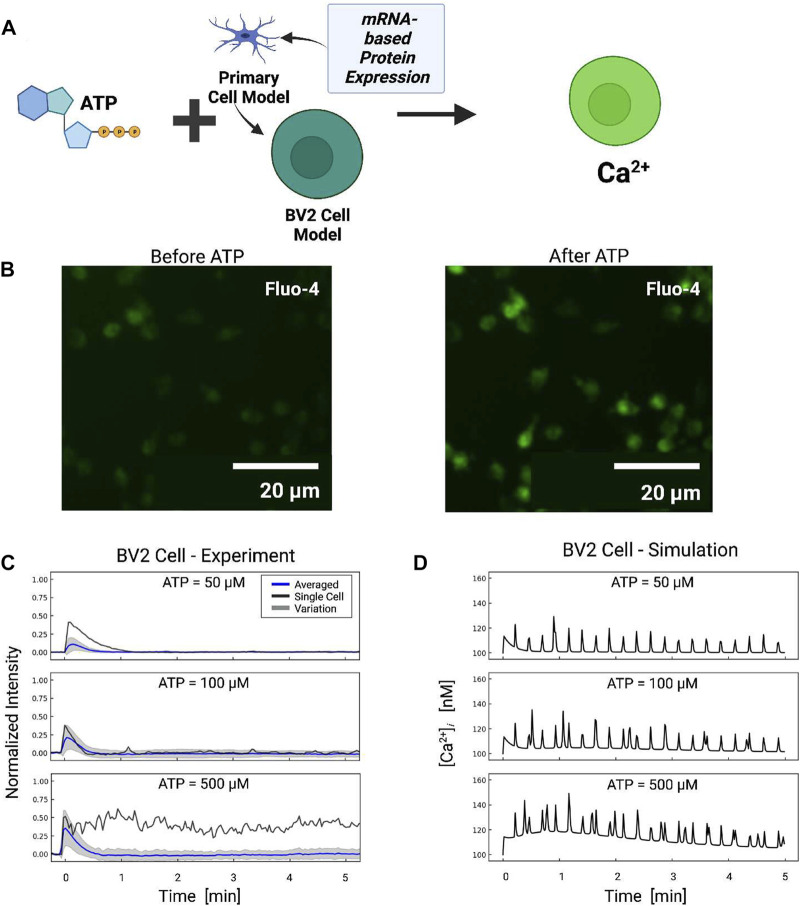
FIGURE 7.
(A) Schematic of ATP-induced Ca2+ transients in BV2 cell simulations assuming P2 expression levels inferred from BV2 cell mRNA (He et al., 2018). (B) Ca2+ transients measured in BV2 microglia before and after ATP treatment. (C) Experimentally measured (blue) and predicted (red) Ca2+ transients from BV2 microglia. The shaded area represents the variation in signals measured in all cells. Oscillatory calcium signals were observed and a representative example of which is reported for each ATP dose (black). Transients recorded in each cell are reported in Fig. S7. (D) Predicted transients in primary microglia for comparison.

