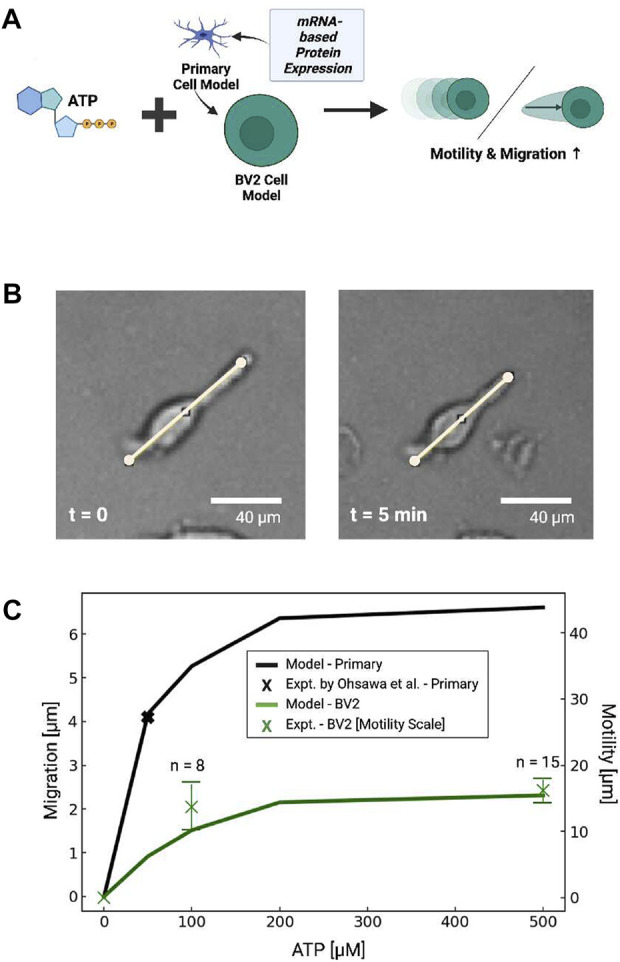
FIGURE 8.

(A) Schematic of predicted migration or displacement in primary microglial cells or cells with P2 expression estimated from BV2 cell mRNA (He et al., 2018). (B) Bright field image demonstrating ATP-dependent displacement of microglial cell membrane (100 µM ATP at 5 min) (C) Predicted (lines) migration or displacement distance following 5 min ATP treatment (0–500 µM) in primary microglia (blue) and BV2 cells (green). Experimental data in primary cells from Ohsawa et al. (2004) and measured in BV2 cells are shown by black and green X’s, respectively, where the bars represent standard error.
