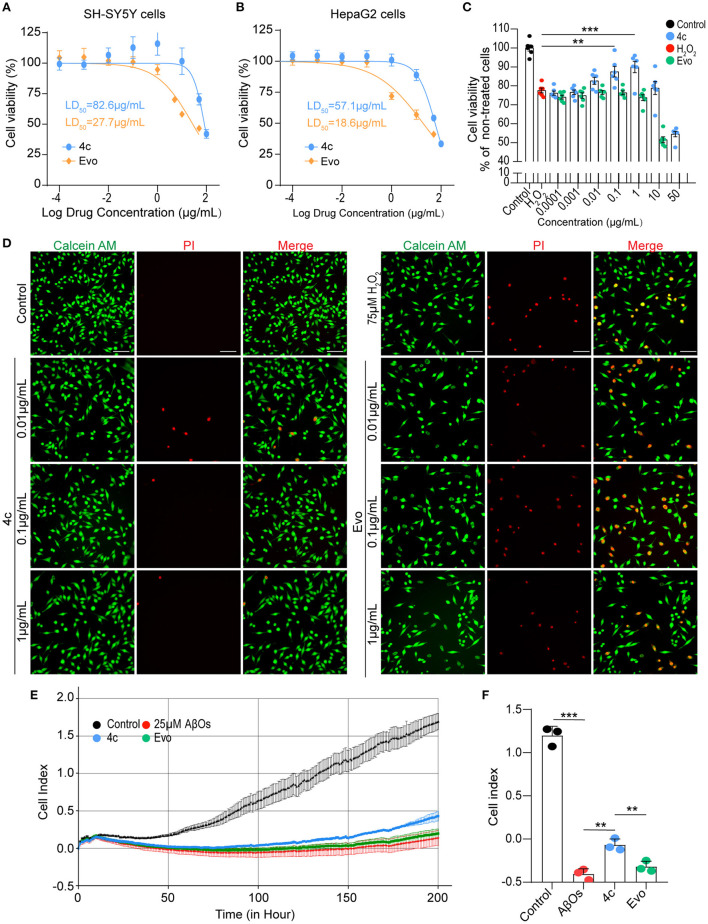
Figure 3.
Determination of the LD50 of 4c and its effects against H2O2 and AβOs. (A, B) The viability of SH-SY5Y and HepaG2 cells was determined by CCK8 after 24 h of exposure to different concentrations of 4c (10−4, 10−3, 10−2, 10−1, 1, 10, 50, and 100 μg/ml) and Evo (10−4, 10−3, 10−2, 10−1, 1, 5, 10, and 50 μg/ml). The LD50 values of 4c and Evo were estimated from the concentrations that resulted in 50% cell viability compared with the vehicle control. Data are represented as mean ± SEM, n = 6. (C) SH-SY5Y cells were incubated with 75 μM H2O2 alone or co-incubated with 75 μM H2O2 and different concentrations of 4c or Evo (10−4, 10−3, 10−2, 10−1, 1, 10, and 50 μg/ml) for 24 h. Cell viability was subsequently quantified using CCK8 and normalized to the cell viability of the vehicle control. Data are represented as mean ± SEM, n = 6. (D) SH-SY5Y cells were incubated with 75 μM H2O2 alone and co-incubated with 75 μM H2O2 and different concentrations of 4c or Evo (10−2, 10−1, and 1 μg/ml) for 24 h. The cells were then stained with calcein-AM/PI, and living and dead cells were detected by green or red fluorescence, respectively. n = 3, Scale bar = 100 μm. (E) SH-SY5Y cells were co-incubated with 25 μM AβOs without or with 0.1 μg/ml 4c or Evo in a real-time cell analyzer for 200 h. The cell index, which represents the real-time cell status, was monitored by the analyzer and analyzed by the RTCA software. (F) The cell index of 4c at 200 h was significantly higher than that of Evo. n = 3; **P < 0.01, and ***P < 0.001.

