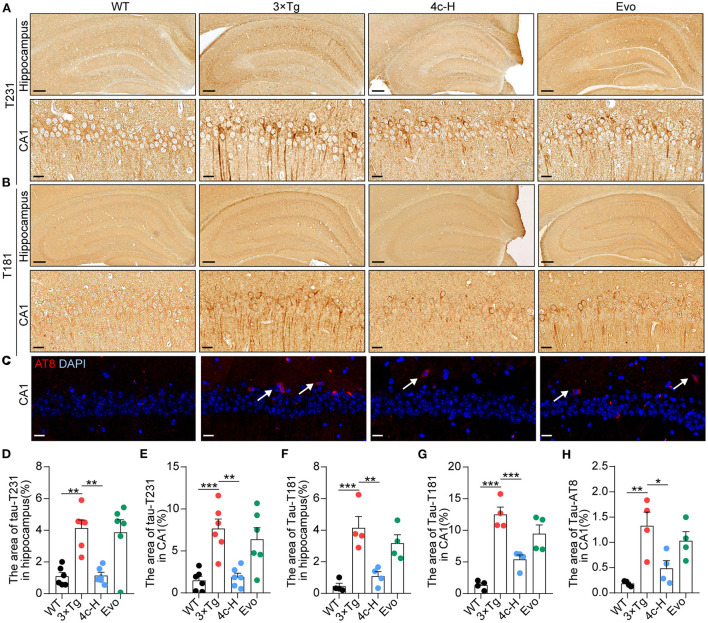
Figure 5.
Determination of Tau phosphorylation in brain tissues. After the MWM test, mice from the WT, 3 x Tg, 4c-H, and Evo groups were sacrificed, and brain tissues were sampled for histological staining. (A, B) Tau phosphorylation was detected via immunohistochemical staining with T231 and T181 antibodies in the mouse hippocampus (scale bar = 200 μm) and hippocampal CA1 region (scale bar = 20 μm). (C) Tau phosphorylation was detected using immunofluorescent staining with the AT8 antibody in the mouse hippocampal CA1 region (white arrowheads indicate AT8-positive cells, scale bar = 20 μm). (D–G) Tau phosphorylation as detected using T231 and T181 antibodies in the hippocampus and the hippocampal CA1 region was quantified by the density of staining using ImageJ. (H) Tau phosphorylation as detected by the AT8 antibody was quantified by red fluorescence. Data are represented as mean ± SEM, n = 6; *P < 0.05, **P < 0.01, and ***P < 0.001.

