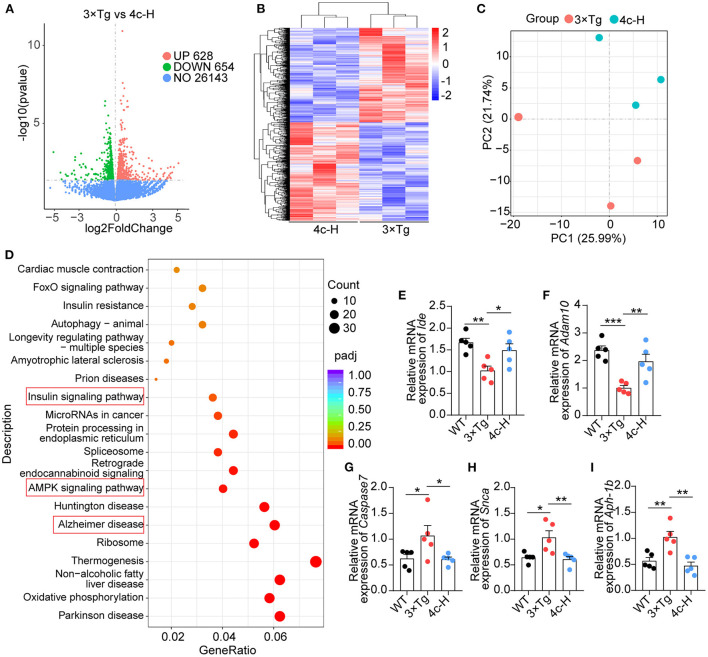
Figure 7.
Transcriptome analysis of hippocampal tissues. Hippocampal tissues from 3 x Tg AD mice treated without or with 4c (i.e., 3 x Tg and 4c-H groups) were selected for transcriptome analysis. (A) Volcano plots of DEGs between the 3 x Tg and 4c-H groups. DEGs were identified by comparing 3 x Tg and 4c-H mice using fold change >1 and P-value <0.05 as the cut-off (n = 3). (B, C) Hierarchical clustering and PCA analysis of the 3 x Tg and 4c-H groups were performed using the normalized RNA-seq read counts. (D) KEGG pathways enriched in the 628 and 654 genes that were upregulated and downregulated, respectively, in 4c-H mice compared with the 3 x Tg mice (n = 3). (E–I) AD-related genes (Ide, Adam10, Caspase7, Snca, and Aph-1b) were detected by RT-qPCR and compared among the WT, 3 x Tg, and 4c-H groups (n = 5). Data are represented as mean ± SEM; *P < 0.05, **P < 0.01, and ***P < 0.001.

