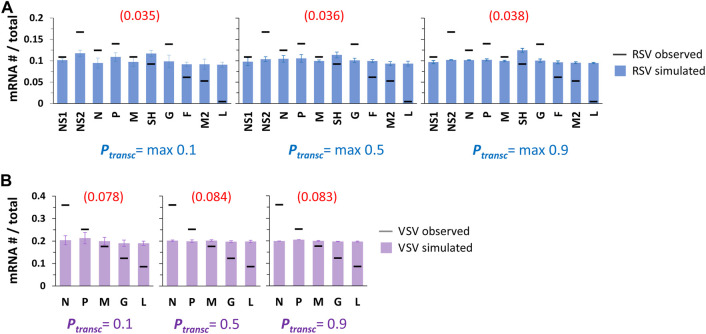
FIGURE 2.
Single pol simulations produce flat patterns of gene expression across P transc values tested. (A) Simulated RSV transcription. Histograms of mRNA # for each RSV gene divided by the total mRNA # show uniform gene expression across the 10 genes for all three sets of P transc tested (max 0.1, max 0.5, and max 0.9). For each set of P transc, the max value equals the probability of transcription at every GS signal except for that of the G gene, which equals 0.65*max. Blue bars depict results from simulations; black horizontal bars depict average published experimentally observed values (Rajan et al., 2022). Each data point is the average of three 100,000 event simulations; error bars show the standard deviation. The number in parentheses and red above each histogram is the root-mean-square deviation (RMSD) of the simulated gene expression pattern from the experimental observations. (B) Simulated VSV transcription. Histograms of mRNA # for each VSV gene divided by the total mRNA # show uniform gene expression across the 5 genes for all three sets of P transc tested (0.1, 0.5, and 0.9). For each set of P transc, the probability of transcription is the same at every GS signal. Lavender bars depict results from simulations; black horizontal bars depict average published experimentally observed values (Iverson and Rose, 1981). Each data point is the average of three 100,000 event simulations; error bars show the standard deviation. The number in parentheses and red above each histogram is the root-mean-square deviation (RMSD) of the simulated gene expression pattern from the experimental observations.

