FIGURE 3.
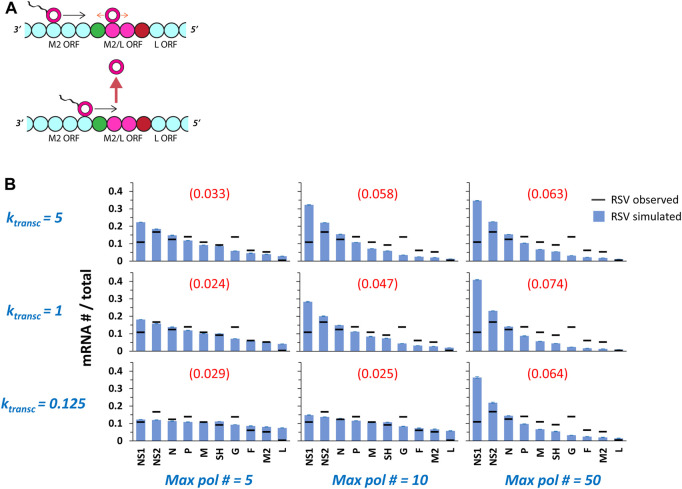
Multiple pols on a single genome undergoing ejective collisions between transcribing and non-transcribing pols produce gene expression gradients of increasing steepness with increasing 5’ translocation rate (k transc ) and increasing maximum pol number (max pol #). (A) The M2/L overlap in ORFs. The final two genes of the RSV genome, M2 (which encodes both a transcription processivity factor and a regulatory factor that enhances replication) and L (which encodes the polymerase), share a 68 nt stretch (approximately two genomic chunks of 28 nts each—depicted as magenta beads) of ORF. This ORF overlap should be a hotspot for collisions between transcribing pols and non-transcribing pols diffusing in the neighborhood of the M2 GE signal (shown as red bead). The L gene GS signal is depicted as a green bead. (B) RSV gene expression patterns over a range of k transc and max pol #. The parameter k transc sets the rate at which transcribing pols move 5’ down the genome (units = genomic chunks per simulated event) and the parameter max pol # sets the maximum number of pols allowed on the genome at one time. Simulations of RSV transcription were performed at three different values of k transc x three different values of max pol #. Histograms of mRNA # for each RSV gene divided by the total mRNA # depict results from the simulations (blue bars) and average published experimentally observed values (black horizontal bars) (Rajan et al., 2022). Each data point is the average of three 100,000 event simulations; error bars show the standard deviation. The number in parentheses and red above each histogram is the root-mean-square deviation (RMSD) of the simulated gene expression pattern from the experimental observations.

