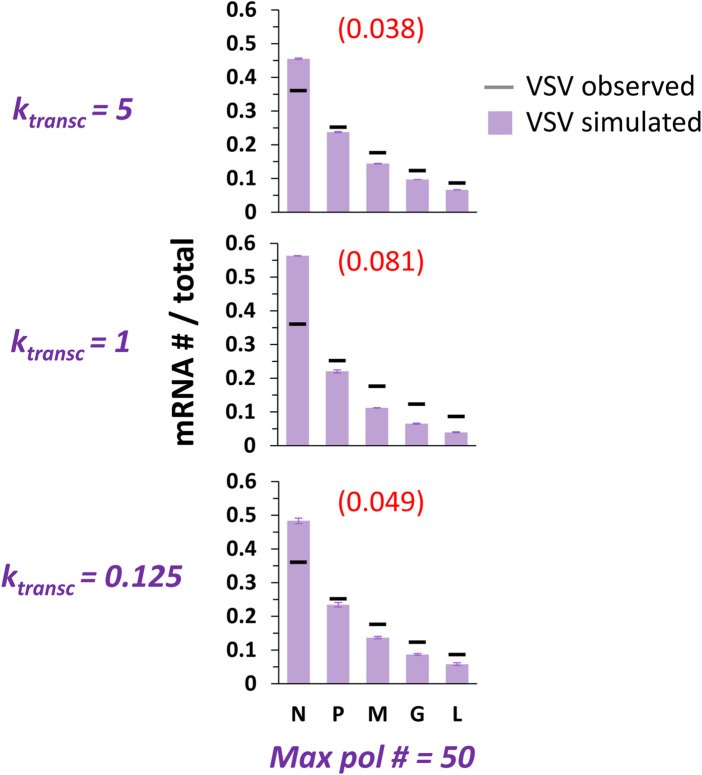
FIGURE 4.
Simulations of at most 50 pols and collision-based pol ejections fit benchmark observations of VSV gene expression best at the highest k transc tested. VSV gene expression patterns over a range of k transc and a single max pol #. The parameter k transc sets the rate at which transcribing pols move 5’ down the genome (units = genomic chunks per simulated event) and the parameter max pol # sets the maximum number of pols allowed on the genome at one time. Simulations of VSV transcription were performed at three different values of k transc . Histograms of mRNA # for each VSV gene divided by the total mRNA # depict results from the simulations (lavender bars) and average published experimentally observed values (black horizontal bars) (Iverson and Rose, 1981). Each data point is the average of three 100,000 event simulations; error bars show the standard deviation. The number in parentheses and red above each histogram is the root-mean-square deviation (RMSD) of the simulated gene expression pattern from the experimental observations.

