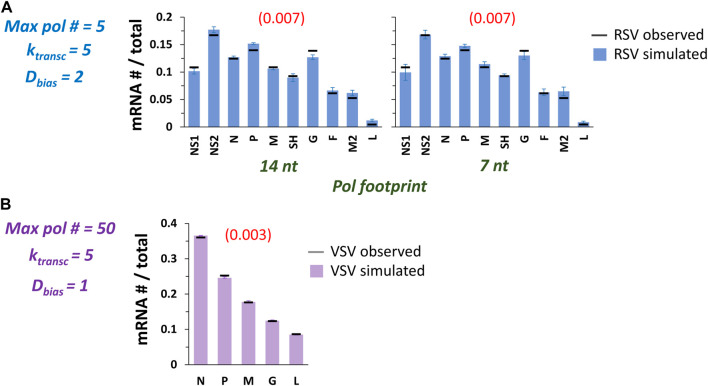
FIGURE 7.
The model captures published observations of RSV and VSV transcription with adjustments to the underlying transcription probabilities (P transc ). (A) High quality fits of experimentally observed RSV gene expression patterns. P transc were manually adjusted to achieve optimized fits at max pol # = 5, k transc = 5, D bias = 2, and pol footprint of 14 and 7 nt. Histograms of mRNA # for each RSV gene divided by the total mRNA # depict results from the simulations (blue bars) and average published experimentally observed values (black horizontal bars) (Rajan et al., 2022). Each data point is the average of three 100,000 event simulations; error bars show the standard deviation. The number in parentheses and red above each histogram is the root-mean-square deviation (RMSD) of the simulated gene expression pattern from the experimental observations. (B) A high quality fit of the benchmark experimentally observed VSV gene expression pattern. P transc were manually adjusted to achieve an optimized fit at max pol # = 50, k transc = 5, D bias = 1 (i.e., NO 5’ bias), and pol footprint = 28 nt. The histogram of mRNA # for each VSV gene divided by the total mRNA # depicts results from the simulations (lavender bars) and average published experimentally observed values (black horizontal bars) (Iverson and Rose, 1981). Each data point is the average of three 100,000 event simulations; error bars show the standard deviation. The number in parentheses and red above the histogram is the root-mean-square deviation (RMSD) of the simulated gene expression pattern from the experimental observations.

