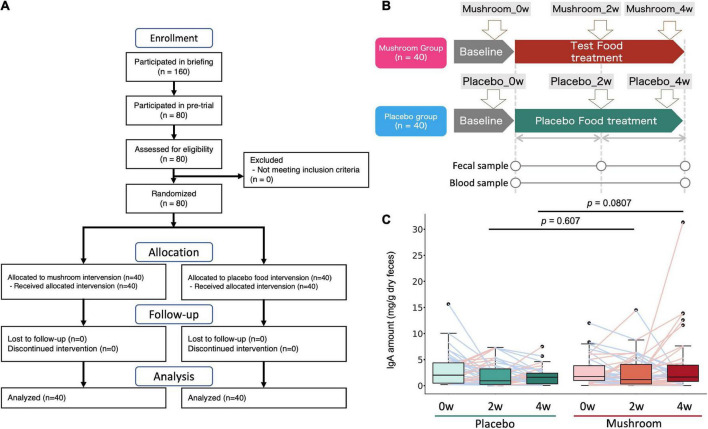
FIGURE 1.
Clinical trial overview and test results for the primary endpoint (intestinal IgA content). (A) Flow diagram of the trial. (B) Clinical trial diagram and description of time points. Subjects were assigned to either the test food (mushroom) group or the placebo food group, and they consumed the assigned food for 4 weeks. (C) Distribution of the primary outcome (intestinal IgA content). The difference between each time point and baseline was calculated and expressed by group and time point. The Wilcoxon rank sum test was performed for comparisons between groups at each intake period (2 or 4 weeks).

