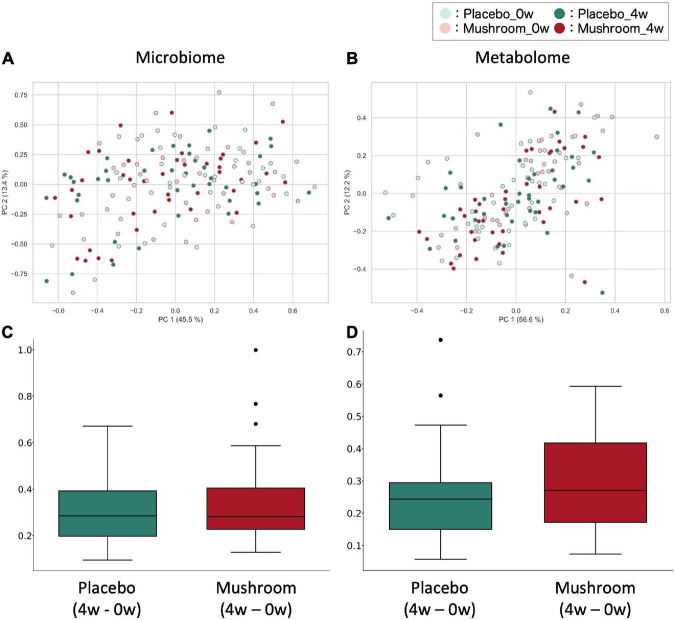
FIGURE 2.
Effect of mushroom consumption on gut microbiota and metabolome profiles. (A,B) The (A) weighted UniFrac distance for the gut microbiota and (B) Bray–Curtis distance for quantitative metabolome profiles among all samples were calculated and visualized by PcoA. (C,D) After calculating the (C) weighted UniFrac distance of the gut microbiota and (D) Bray–Curtis distance of the quantitative metabolome profiles among all samples, the differences in distances before and after ingestion of the same subjects were evaluated and are shown here for each group. No significant differences were detected in either case (Wilcoxon rank sum test).

