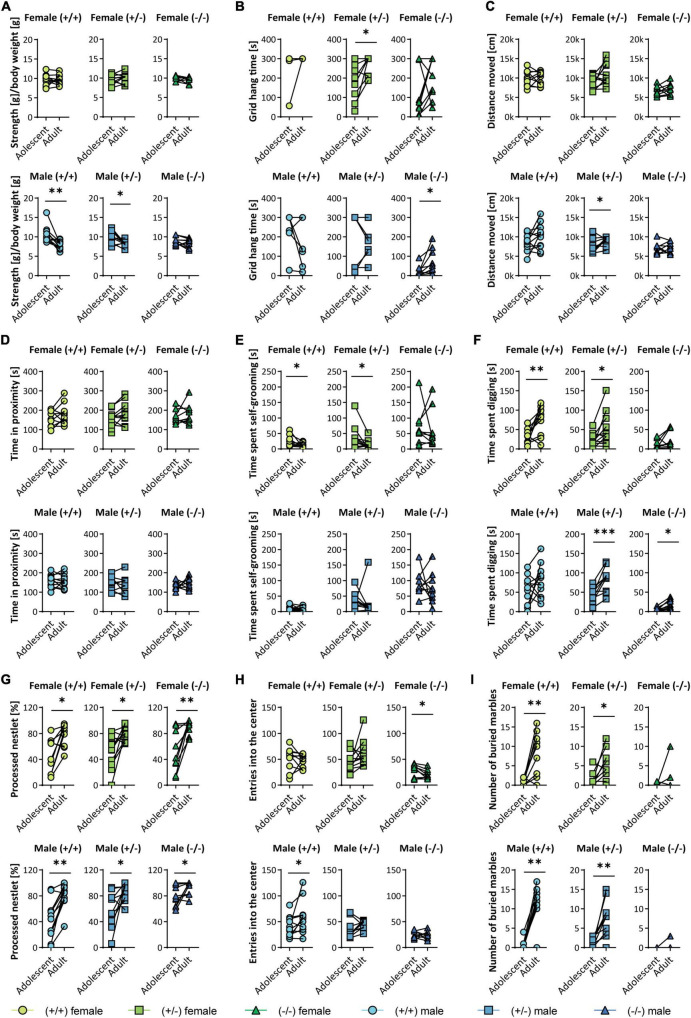
FIGURE 4.
Trajectory analysis of individual animals between baseline (adolescent) and follow-up (adult) Shank3(+/–). A selected set of tests is analyzed longitudinally and displayed as follows: female (upper panels) and male (lower panels), wildtype (left), Shank3(±) (middle), and Shank3(–/–) (right) mice. Graphs are displayed for (A) the normalized strength [strength/body weight] in the grip strength test for all four paws, (B) grid hang time in the grid hanging test, (C) the distance moved in the open field test, (D) the time the testing mouse spent in proximity (< 3.5 cm) to a same-sex stranger in the direct social dyadic test, (E) the time the animal spent self-grooming and (F) digging, (G) the percentage of processed material in the nestlet shredding test, (H) the number of entries into the center zone of the open field arena during a 30 min trial, and (I) the number of buried marbles in the marble burying test. Data are presented for each individual animal at baseline and follow-up and was analyzed by paired two-tailed t-test for parametric data and by Wilcoxon matched pairs signed rank test for non-parametric data. Significance levels (p-values) are set to 0.05 (p ≤ 0.05*, p ≤ 0.01**, p ≤ 0.001***) with 95% confidence interval. Detailed statistical information for all data sets can be found in Supplementary Table 5.

