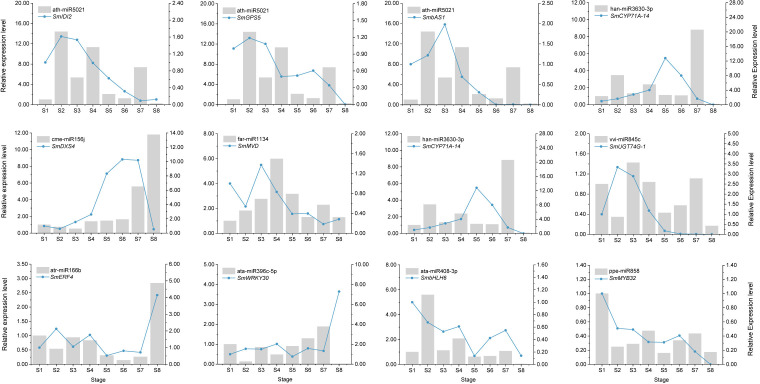
Figure 7.
Expression correlation of miRNAs and their targets. The bars and lines indicate the relative expression level of miRNAs and their corresponding targets in the eight developmental stages of soapberry pericarps. The Y-axis on the left and right represents the abundance of the miRNAs and their targets, respectively. SnRNA U6 and SmACT were used for normalizing the relative expression of miRNAs and their targets, respectively. The expression level of the miRNAs and their corresponding targets in the stage S1 were set as 1.0. Relative expression level was calculated using the 2–ΔΔ C t method. Data indicate the mean values of three biological replications.

