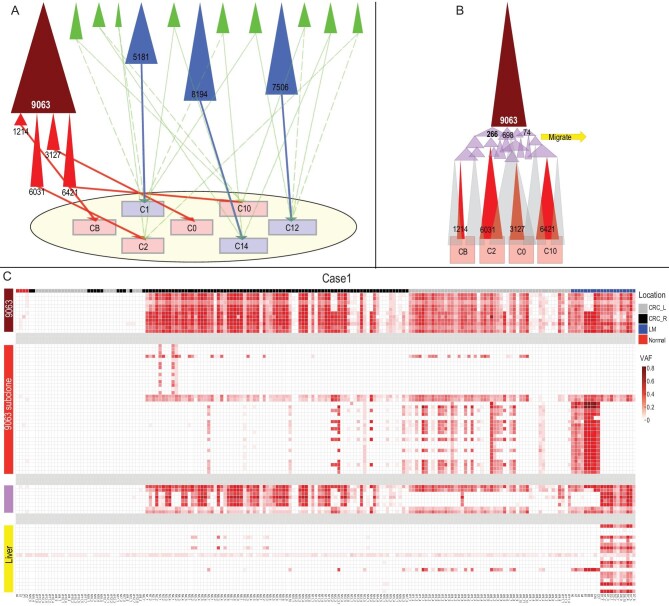
Figure 2.
The clonal composition of the Case 1 tumor revealed by WGS and target validation. (A) Clones identified in Table 1 are represented by shaded triangles, named by the number of mutations associated with the clone. The clones are shaded in five different colors: maroon, red, pink (which form a family), blue and green. The distribution of these clones among the seven WGS samples from the tumor (the oval) are shown by the thin lines. The four red clones are all subclones of the parent Clone 9063. Note the presence of 13 independent clones consisting of a dominant clone (represented by maroon and its red subclones), 3 large blue clones and 9 small green clones (see Table 1). Cells of the small green clones are dispersed, presumably by the dominant maroon clone as it expands. (B) The widely distributed maroon clone spawns the four sample-specific red clones via a large number of pink clones, which represent a stage of geographical expansion of the maroon clone. Hence, the pink clones are less localized than the larger red subclones. The approximate timing of the metastasis to the liver is indicated by the block yellow arrow at the pink-clone stage. (C) Mapping the distribution of the maroon, red and pink clones across the 138 samples from the primary tumor and the liver metastases. Each column represents a sample. labeled by different colors (black, orange and cyan) on the top row of the heat map to show their locations. Each row represents the distribution of an SNV across the 138 samples. The collection of 106 SNVs are separated into four groups (maroon, red and pink as shown in Fig. 2A plus the yellow group, representing mutations of the liver metastasis). The color intensity in each box indicates the frequency of the SNV in each sample.

