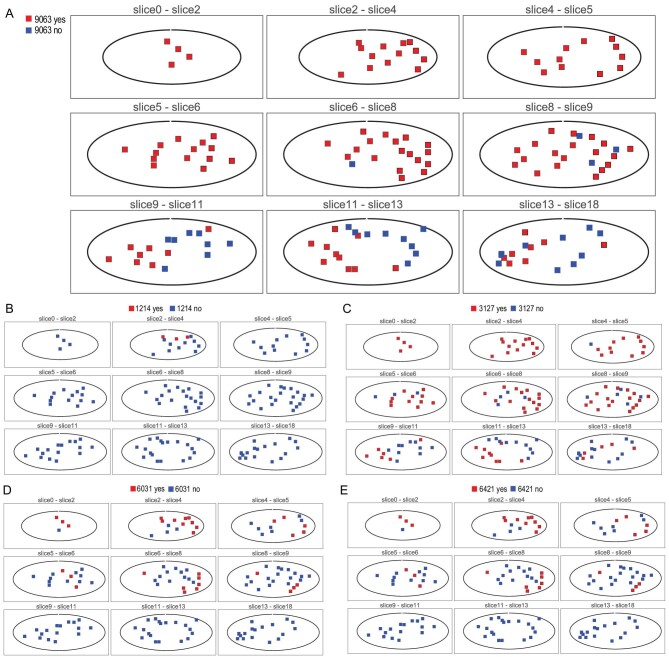
Figure 3.
The 3D distributions of SNVs across 138 samples from nine serial planes in Case 1. Each of the five groups of mutations is shown as present (red) or absent (blue) among the nine planes (one plane for each panel) of the tumor. Each plane represents a composite of two or three neighboring slices from the 18 serial slices of the tumor as illustrated in Supplementary Fig. S1. (A) Note that the SNVs from the major Clone 9063 (maroon in Fig. 2) are not found in many samples of the lower three planes. The geographical distribution of SNVs from the four red clones (the subclones of the parental Clone 9063) are showed from (B to E). These subclones are indeed strongly localized, supporting the interpretation given in Fig. 2.

