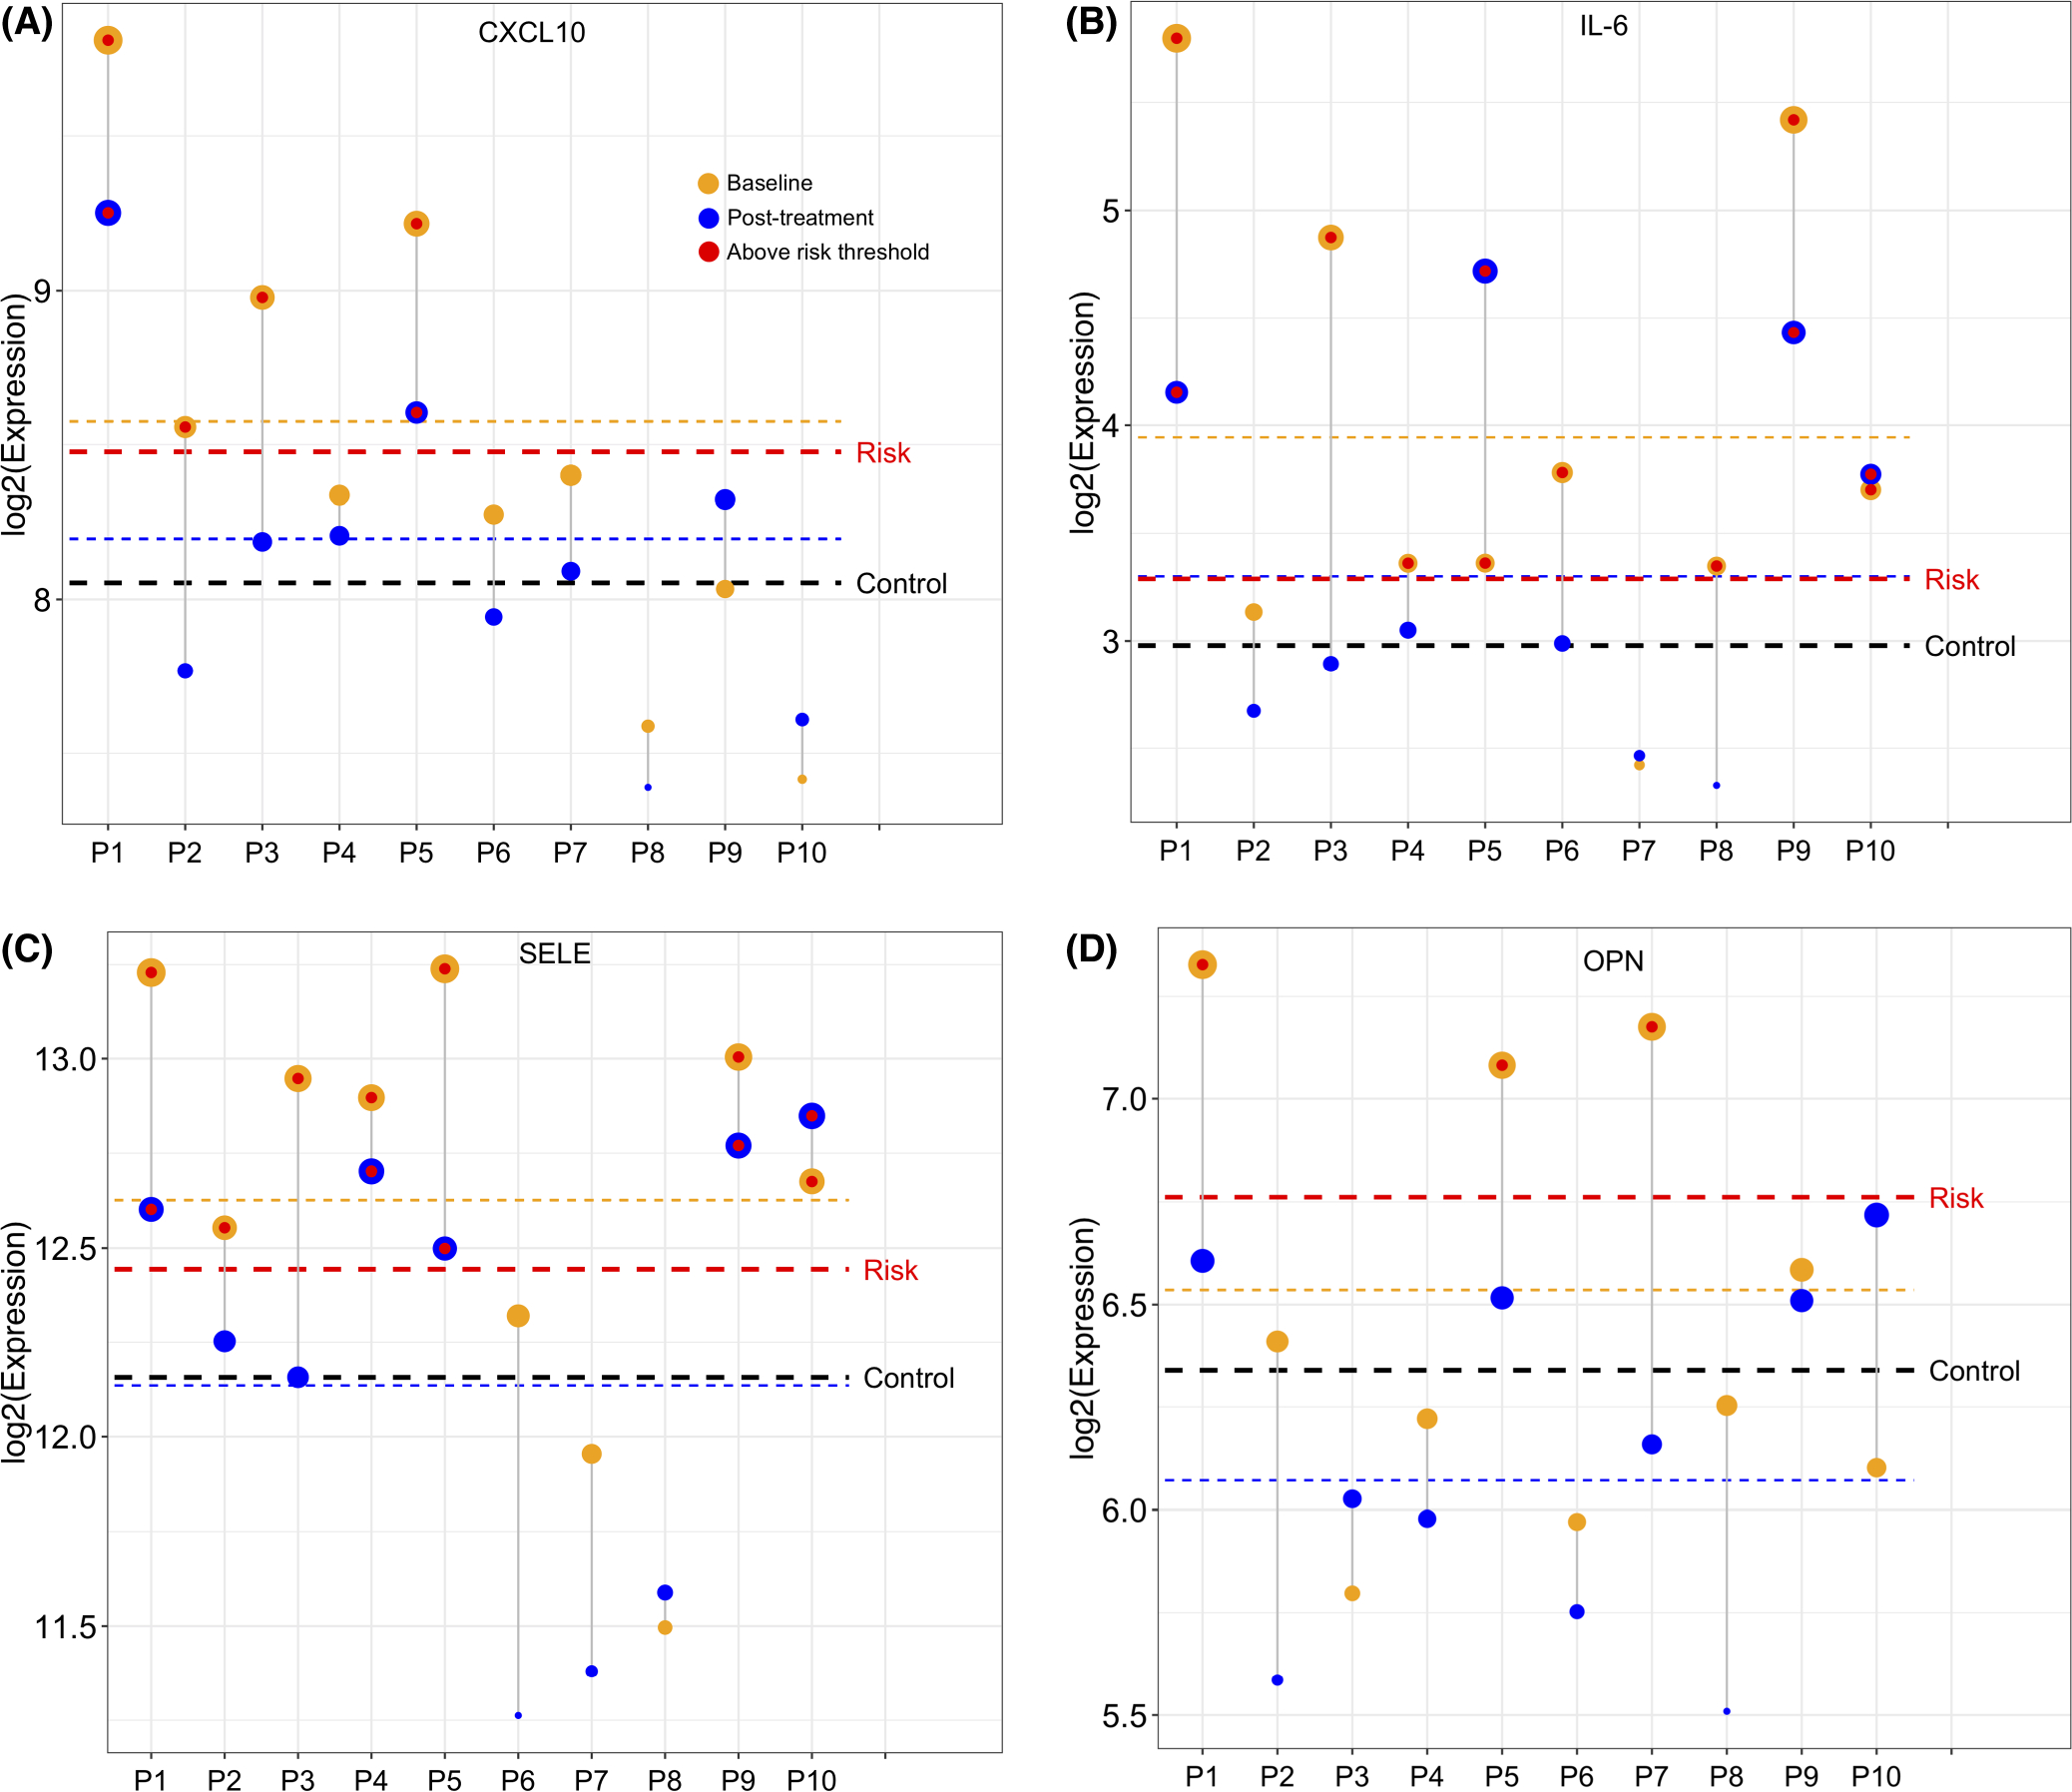
FIGURE 2.

Mean and individual protein levels in psoriasis patients before and after ustekinumab treatment compared with the protein’s cardiovascular risk threshold. Red line indicates the calculated cardiovascular (CV) risk threshold for each protein according to its respective study. Yellow line indicates least squared (LS) mean protein level of psoriasis cohort at baseline. Blue line indicates LS mean protein level in psoriasis cohort after treatment. Black line indicates LS mean protein level in controls. P1-P10 indicates Patient 1—Patient 10. Yellow circles indicate individual patient’s protein level before treatment and blue circles indicate patient’s protein level after treatment. Red circle indicates protein level in individual is above CV risk threshold. CXCL10 = C-X-C motif chemokine 10; IL-6 = interleukin-6; SELE = E-selectin; OPN = osteopontin. (A) LS mean and individual CXCL10 levels in psoriasis cohort at baseline and after treatment in comparison with the CV risk threshold conferred by CXCL10 in Herder et al.’s study.39 (B–D) LS mean and individual protein levels at baseline and after treatment in comparison to CV risk threshold for IL-6 according to Ridker et al.41(B), for SELE according to Matsumoto et al.24(C), for OPN according to Kato et al.32(D)
