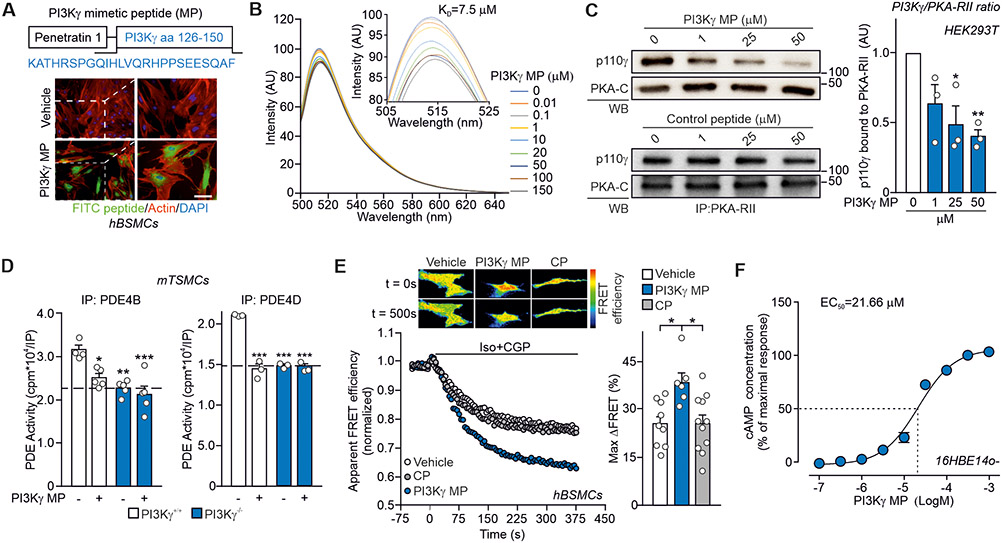
Fig. 2. PI3Kγ MP enhances airway β2-AR/cAMP signaling in vitro.
(A) Top, schematic representation of the cell-permeable PI3Kγ mimetic peptide (PI3Kγ MP). The 126-150 region of PI3Kγ was fused to the cell-penetrating peptide penetratin 1 (P1). Bottom, intracellular fluorescence of human bronchial smooth muscle cells (hBSMCs) following 1 hour incubation with a FITC-labeled version of PI3Kγ MP (50 μM) or vehicle. Scale bar: 10 μm. (B) Steady-state emission spectra of recombinant fluorescein 5-maleimide-labelled PKA-RII (PKA-F5M) in the presence of increasing concentrations of PI3Kγ MP (0-150 μM), revealing a dissociation constant for PI3Kγ MP/PKA-RII interaction of 7.5 μM. (C) Co-immunoprecipitation of the catalytic subunit of PI3Kγ (p110γ) and PKA-RII from HEK-293T cells expressing p110γ and exposed to increasing doses of PI3Kγ MP for 2 hours. Representative immunoblots (left) and relative quantification (right) of n=3 independent experiments are shown. (D) PDE4B and PDE4D activity in PI3Kγ+/+ and PI3Kγ−/− mouse tracheal smooth muscle cells (mTSMCs) treated with either vehicle (Veh) or PI3Kγ MP (50 μM) for 30 min. For PDE4B IP: PI3Kγ+/++Veh n=4; PI3Kγ+/++PI3Kγ MP n=5; PI3Kγ−/−+Veh n=5 and PI3Kγ−/−+ PI3Kγ MP n=5 independent cultures. For PDE4D IP: n=3 independent cultures in all groups. (E) Representative FRET traces (left) and maximal FRET changes (right) in human tracheal smooth muscle cells (hBSMCs) expressing the ICUE3 cAMP FRET sensor and pre-treated for 30 min with vehicle (n=9), 50 μM PI3Kγ MP (n=6) or equimolar control peptide (CP; n=11) before activation of β2-adrenergic receptors (β2-ARs) with isoproterenol and the β1-AR antagonist CGP-20712A (Iso + CGP; 100 nM each). Insets show representative intensity-modulated pseudocolor images at t = 0 s and 500 s after the addition of Iso+CGP. n indicates the number of cells analysed in n=3 independent experiments. (F) cAMP elevation in human bronchial epithelial cells (16HBE14o-) in response to increasing concentrations of PI3Kγ MP (31.6 nM – 316 μM range) for 30 min. The amount of cAMP was expressed as percentage of cAMP accumulation elicited by 100 μM PI3Kγ MP. N=6 independent experiments. In (C), (D) and €, *P<0.05, **P<0.01, ***P<0.001 by one-way ANOVA followed by Bonferroni’s post-hoc test. In (F), non-linear regression analysis was used. Throughout, data are mean ± SEM.

