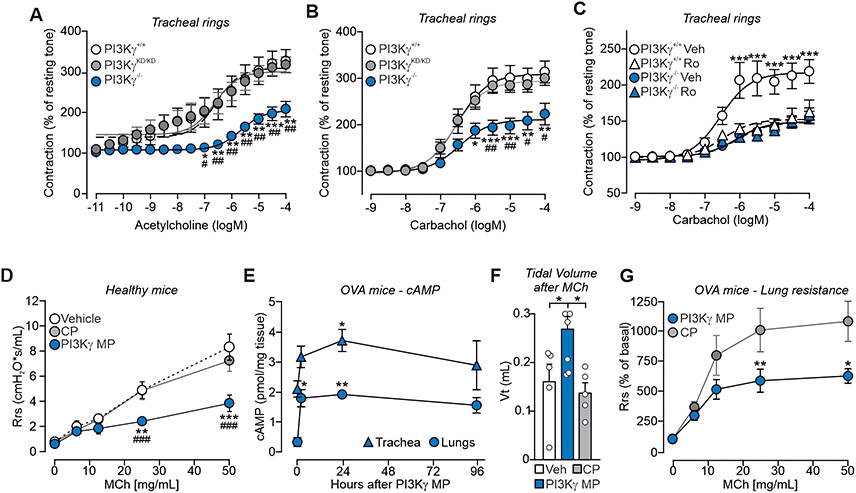
Fig. 4. PI3Kγ MP promotes airway relaxation ex vivo and in vivo in a mouse model of asthma.
(A and B) Cumulative contractile response of PI3Kγ+/+, PI3KγKD/KD and PI3Kγ−/− tracheal rings to increasing concentrations of acetylcholine (A) and carbachol (B). The developed tension is expressed as a percentage of the resting tone. In (A), PI3Kγ+/+ n=7, PI3KγKD/KD n=6 and PI3Kγ−/− n=5 mice. In (B), PI3Kγ+/+ n=9, PI3KγKD/KD n=6 and PI3Kγ−/− n=5 mice. (C) Cumulative contractile response to carbachol of PI3Kγ+/+ and PI3Kγ−/− tracheal rings pre-treated with either vehicle (Veh) or the PDE4 inhibitor Roflumilast (Ro, 10 μM) for 30 min. PI3Kγ+/++Veh n=10, PI3Kγ+/++Ro n=5, PI3Kγ−/−+Veh n=13, and PI3Kγ−/−+Ro n=9 mice. (D) Average lung resistance in healthy mice treated with vehicle (n=4), 1.5 μg PI3Kγ MP (n=4) or equimolar amount of control peptide (CP; n=5) directly before exposure to increasing doses of the bronchoconstrictor methacholine (MCh). (E) cAMP concentrations in lungs and tracheas of ovalbumin (OVA)-sensitized mice at the indicated time points after intra-tracheal administration of PI3Kγ MP (15 μg). The number of mice (n) ranged from 3 to 8 per group. (F) Tidal volume of ovalbumin (OVA)-sensitized mice pre-treated with vehicle (n=5), PI3Kγ MP (15 μg; n=6) and CP (equimolar amounts; n=5) and exposed to methacholine (MCh; 500 μg/kg). (G) Average lung resistance (expressed as % of basal) in OVA-sensitized mice treated with 15 μg of PI3Kγ MP (n=9) or equimolar amount of CP (n=10) 30 min before methacholine challenge. In (A) and (B), *P<0.05, **P<0.01 and ***P<0.001 versus PI3Kγ+/+ and #P<0.05 and ##P<0.01 versus PI3KγKD/KD by two-way ANOVA followed by Bonferroni’s multiple comparisons test. In (C), **P<0.01 and ***P<0.001 for PI3Kγ+/++Veh versus all other groups by two-way ANOVA followed by Bonferroni’s multiple comparisons test. In (D), **P<0.01 and ***P<0.001 versus vehicle and ### P<0.001 versus CP by two-way ANOVA followed by Bonferroni’s post-hoc test. In (E) and (F), *P<0.05 and **P<0.01 by one-way ANOVA followed by Bonferroni’s post-hoc test. In (G), *P<0.05 and **P<0.01 between groups by two-way ANOVA followed by Bonferroni’s post-hoc test. Throughout, data are mean ± SEM.

