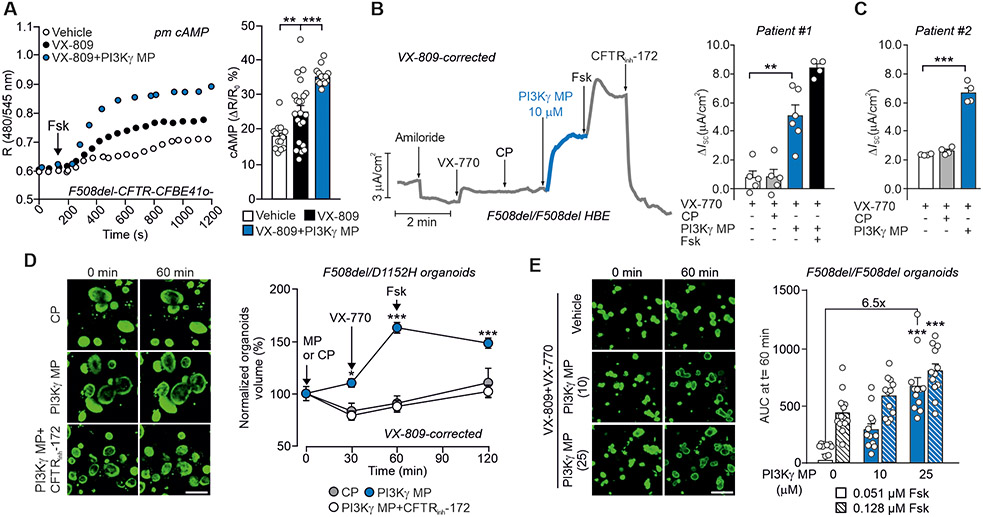
Fig. 7. PI3Kγ MP potentiates the therapeutic effects of CFTR modulators in CF in vitro models.
(A) Representative FRET traces (left) and maximal FRET changes (right) in CFBE41o- cells overexpressing F508del-CFTR and the plasma membrane-targeted FRET probe for cAMP (pm cAMP). Cells were pre-incubated with vehicle (Veh), the CFTR corrector VX-809 (5 μM) alone or together with PI3Kγ MP (25 μM) before treatment with 1 μM Fsk. R is the normalized 480 nm/545nm emission ratio calculated at indicated time points. Veh n=12, VX-809 n=22 and VX-809+PI3Kγ MP n=16 where n is the number of cells from n=3 independent experiments. (B) Left, Representative trace of short-circuit currents (ISC) in primary human bronchial epithelial cells from a donor with CF (Patient #1) homozygous for the F508del mutation (F508del/F508del HBE) and grown at the air-liquid interface (ALI). Cells were corrected with VX-809 for 48 hours (5 μM) and then exposed to the following drugs at the indicated times: Amiloride (Amil, 100 μM), CP (10 μM), PI3Kγ MP (10 μM), forskolin (Fsk, 10 μM), VX-770 (1 μM) and the CFTR inhibitor 172 (CFTRinh-172; 10 μM). Right, Average total current variation in response to VX-770 (1 μM), CP (10 μM), PI3Kγ MP (10 μM) and forskolin (Fsk, 10 μM) of n=4 technical replicates of the same donor. (C) Average total current variation in response to VX-770 (1 μM), CP (25 μM) and PI3Kγ MP (25 μM) in F508del/F508del HBE cells from a second donor with CF (Patient #2) grown at ALI and pre-corrected with VX-809 for 48 hours (5 μM). n=4 technical replicates of the same donor. Representative ISC traces are provided in Fig. S9A-C. (D) Representative confocal images and forskolin-induced swelling (FIS) of calcein green-labeled rectal organoids from a patient carrying compound CF F508del and D1152H mutations (F508del/D1152H). Organoids were corrected with VX-809 (3 μM) for 24 hours, incubated with calcein-green (3 μM) for 30 min and exposed to either PI3Kγ MP or CP (both 25 μM) for 30 min before stimulation with Fsk (2 μM). Organoid response was measured as percentage change in volume at different time points after addition of Fsk (t=30, t=60, and t=120 min) compared to the volume at t=0. n=15-34 organoids from 1 donor in n=2 independent experiments. Scale bar: 200 μm. (E) FIS responses (right) and representative confocal images (left) of calcein green-labeled rectal organoids from a CF patient homozygous for the F508del mutation (F508del/F508del). Organoids were pre-incubated with the CFTR corrector VX-809 (3 μM) and the CFTR potentiator VX-770 (3 μM) for 24 hours before exposure to two different concentrations of Fsk (0.51 μM; 0.128 μM) and PI3Kγ MP (10 μM; 25 μM). The peptide was added to the organoids together with Fsk. Organoid response was measured as area under the curve of relative size increase of organoids after 60 min Fsk stimulation, t = 0 min: baseline of 100%. n=12 organoids/group analyzed in n=2 independent cultures from n=2 different donors. Scale bar: 200 μm. In (A), (B), and (C), **P <0.01 and ***P <0.001 by one-way ANOVA followed by Bonferroni’s post-hoc test. In (D), *P<0.05 and ***P<0.001 by two-way ANOVA followed by Bonferroni’s post-hoc test. In (E), ***P <0.001 by Kruskal Wallis test followed by Dunn’s multiple comparison test. Throughout, data are mean ± SEM

