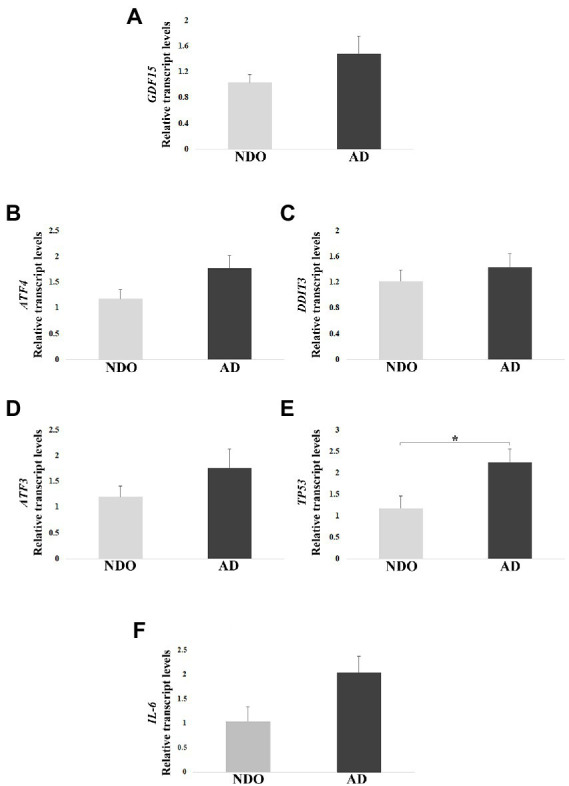
Figure 2.

Real-Time RT-PCR analysis in AD patients (AD) and age-matched non-demented old controls (NDO). (A) GDF15, (B) ATF4, (C) DDIT3, (D) ATF3, (E) TP53, and (F) IL-6 relative transcript levels in frontal cortex samples from 10 AD and 5 NDO. The bars represent mean ± SE. Student’s t test was applied. *p < 0.05.
