Figure 3.
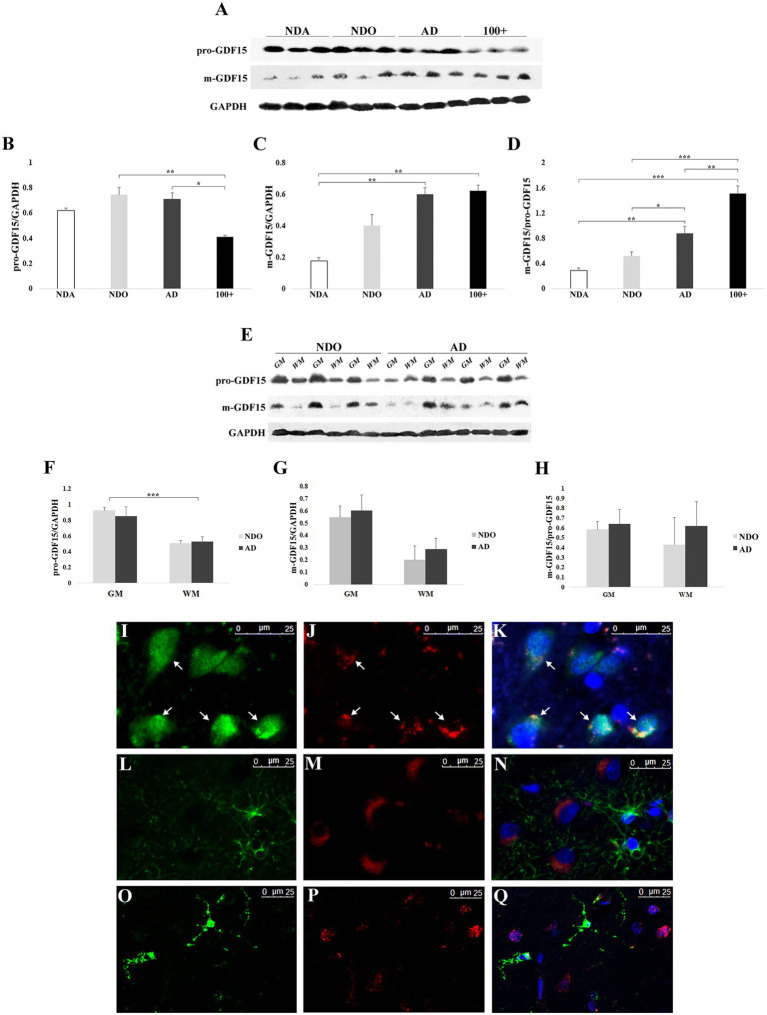
Western blotting and immunofluorescence analyses of GDF15 in the frontal cortex. (A) Representative immunoblotting image of pro-GDF15, m-GDF15, and GAPDH in frontal cortex. Relative protein expression of (B) pro-GDF15, (C) m-GDF15, and (D) m-GDF15/pro-GDF15 ratio in frontal cortex from three non-demented adults (NDA), 11 non-demented old subjects (NDO), 11 AD patients (AD) and three centenarians (100+). (E) Immunoblotting image of pro-GDF15 and m-GDF15 in gray (GM) and white (WM) matter of frontal cortex from 3 NDO and 4 AD. Relative protein expression of (F) pro-GDF15, (G) m-GDF15 and (H) m-GDF15/pro-GDF15 in GM ad WM from 3 NDO and 4 AD. (I-Q) Fluorescence microscopy analysis in frontal cortex. (I) NeuN (green), (J) GDF15 (red), and (K) merge; nuclei (DAPI). Arrows indicate colocalization of GDF15 and NeuN signals. (L) GFAP (green), (M) GDF15 (red), and (N) merge; nuclei (DAPI). (O) TMEM119 (green), (P) GDF15 (red), and (Q) merge; nuclei (DAPI). The bars represent mean ± SE. Student’s t and one-way ANOVA tests with Bonferroni correction were applied. Western blotting quantification was performed using ImageJ software and normalized to GAPDH expression. *p < 0.05. **p < 0.01. ***p < 0.001.

