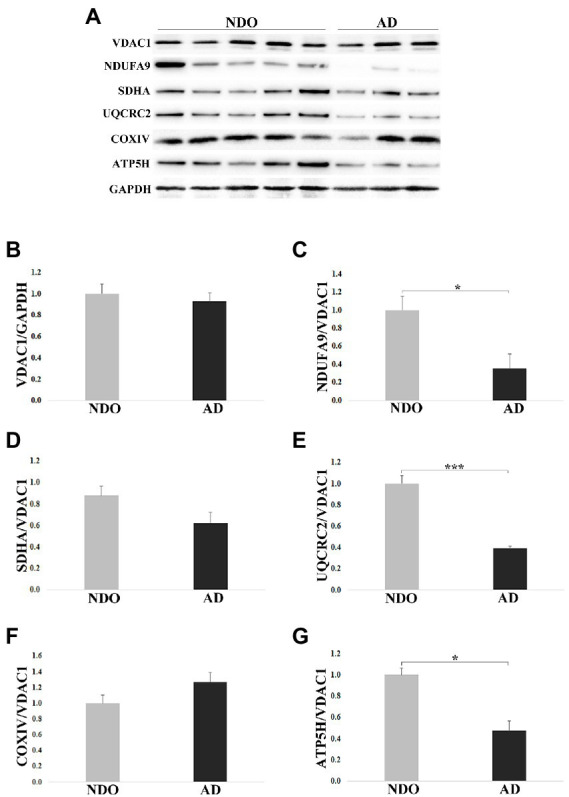
Figure 5.

Western blotting analysis of mitochondrial complex subunits in frontal cortex from 11 non-demented old subjects NDO and 6 AD patients (AD). (A) Representative immunoblotting image, (B–G) relative protein expression of VDAC1, NDUFA9, SDHA, UQCRC2, COXIV and ATP5H. The bars represent mean ± SE. Student’s t and one-way ANOVA tests with Bonferroni correction were applied. Western blotting quantification was performed using ImageJ software and normalized to GAPDH expression. Relative expression of OXPHOS proteins was normalized to VDAC1 expression. *p < 0.05. ***p < 0.001.
