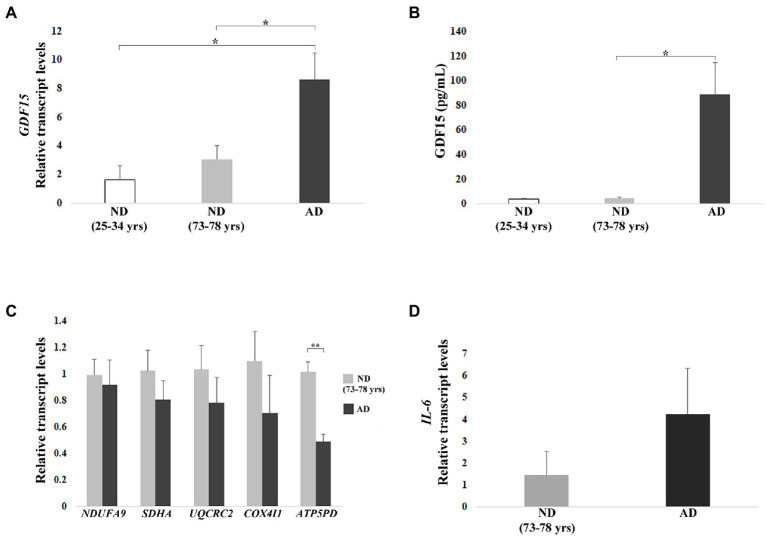
Figure 6.
Real-time RT-PCR analyses and ELISA in dermal fibroblasts (DFs) from three non-demented young subjects (ND, age range 25–34 years), 8 non-demented old subjects (ND, age range 73–78 years), and 3 AD patients (AD). (A) Relative GDF15 transcript level and (B) quantification by ELISA of GDF15 protein secreted in the culture medium. (C) Mitochondrial complex subunits (NDUFA9, SDHA, UQCRC2, COX4I1, ATP5PD) and (D) IL-6 relative transcript levels. The bars represent mean ± SE. Student’s t and one-way ANOVA tests with Bonferroni correction were applied for transcript-level analyses. Kruskal–Wallis test was applied for ELISA analysis [AD vs. ND (25–34 years) p = 0.067]. *p < 0.05. **p < 0.01.

