Figure 7.
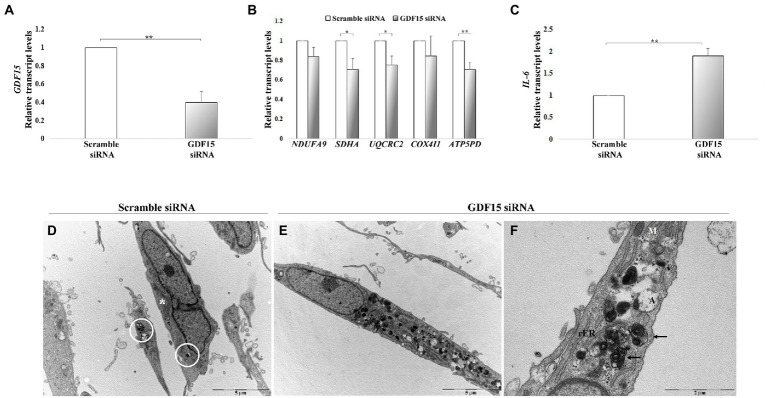
GDF15 knock-down (KD) in dermal fibroblasts (DFs). (A–C) Real-time RT-PCR analysis in DFs from fives non-demented old subjects in the age range 73–78 (ND) and 3 AD patients (AD) after GDF15 KD by small interfering RNA (siRNA) technique. Relative transcript levels of (A) GDF15, (B) mitochondrial complex subunits (NDUFA9, SDHA, UQCRC2, COX4I1, ATP5PD), and (C) IL-6 in scramble siRNA and GDF15 siRNA DFs. The bars represent mean ± SE. Student’s t and one-way ANOVA tests with Bonferroni correction were applied for transcript-level analyses. *p < 0.05. **p < 0.01. (D–F) Transmission electron microscopy. The ultrastructural morphology of DFs has been compared in scramble siRNA-treated DFs and GDF15 siRNA-treated DFs. (D) Scramble siRNA-treated DFs show a spindled morphology with long bidirectional projections. In the cytoplasm there are several mitochondria (*) some of which are degenerated (white circle). Scale bar = 5 μm. (E) After GDF15 KD (GDF15 siRNA), DFs accumulate degenerated mitochondria that appear as electron-dense round bodies associated with autophagosomes. Scale bar = 5 μm. (F) Magnification of panel E showing degenerated dense mitochondria with whorled cristae (arrows) and autophagosomes. Scale bar = 2 μm. Legend: M: normal mitochondrion; rER: rough endoplasmic reticulum; A: autophagosomes.

