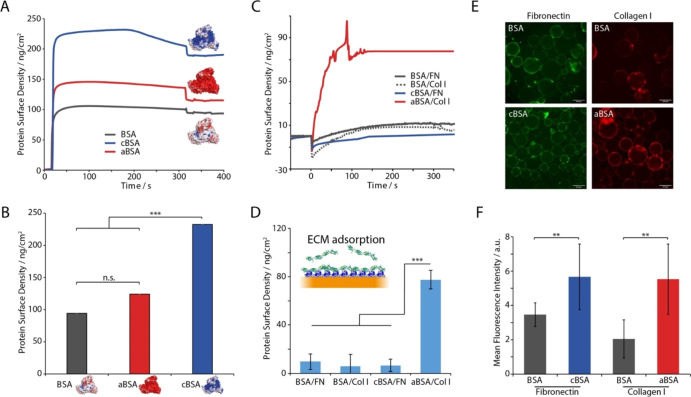
Figure 3.
(A) Representative SPR traces of the adsorption of supercharged albumins and native BSA to perfluorodecanethiol monolayers modeling fluorinated oil interfaces. (B) Corresponding quantification of resulting protein surface densities. (C) SPR quantification of FN or collagen type I (Col I) adsorption at the surface of supercharged protein layers. (D) Corresponding protein surface densities. (E) Epifluorescence microscopy images of FN or Col I adsorption onto BSA, cBSA, and aBSA emulsions; green, FN; red, Col I. Scale bars, 200 μm. (F) Quantification (mean fluorescence intensity) of adsorbed FN or Col I on corresponding protein nanosheets. Error bars are s.e.m.; n = 3.

