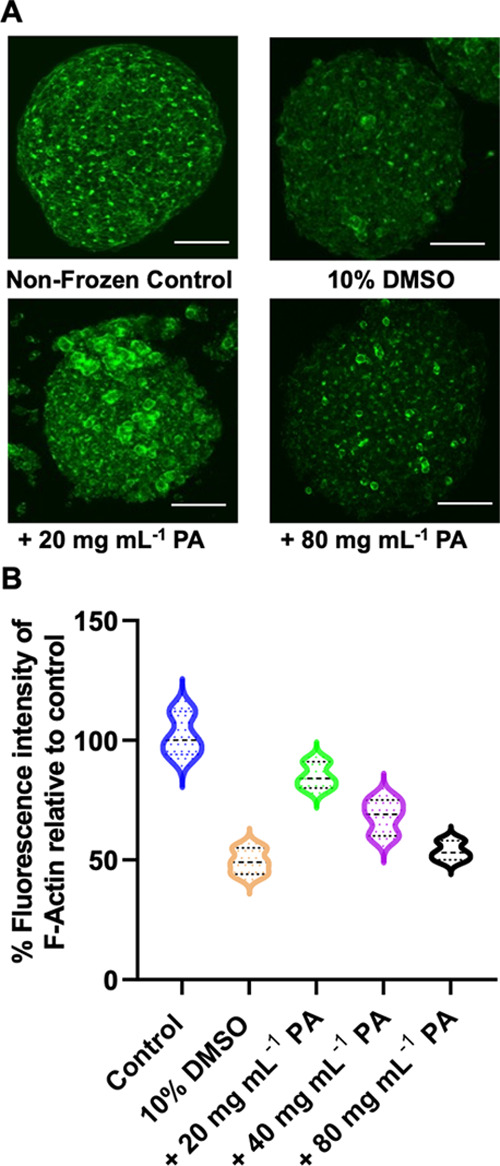
Figure 3.

F-actin staining of HepG2 spheroids. (A) Images of HepG2 spheroids pre- and post-thaw (24 h) following cryopreservation using the indicated cryoprotectants; (B) mean fluorescence intensity (MFI) of phalloidin stained F-actin relative to control, non-frozen, spheroids. Data are presented as mean % MFI ± SEM from five independent repeats. Cells were stained for F-actin (phalloidin, green) and nuclei (Hoechst 33342, blue). Scale bars = 100 μm.
