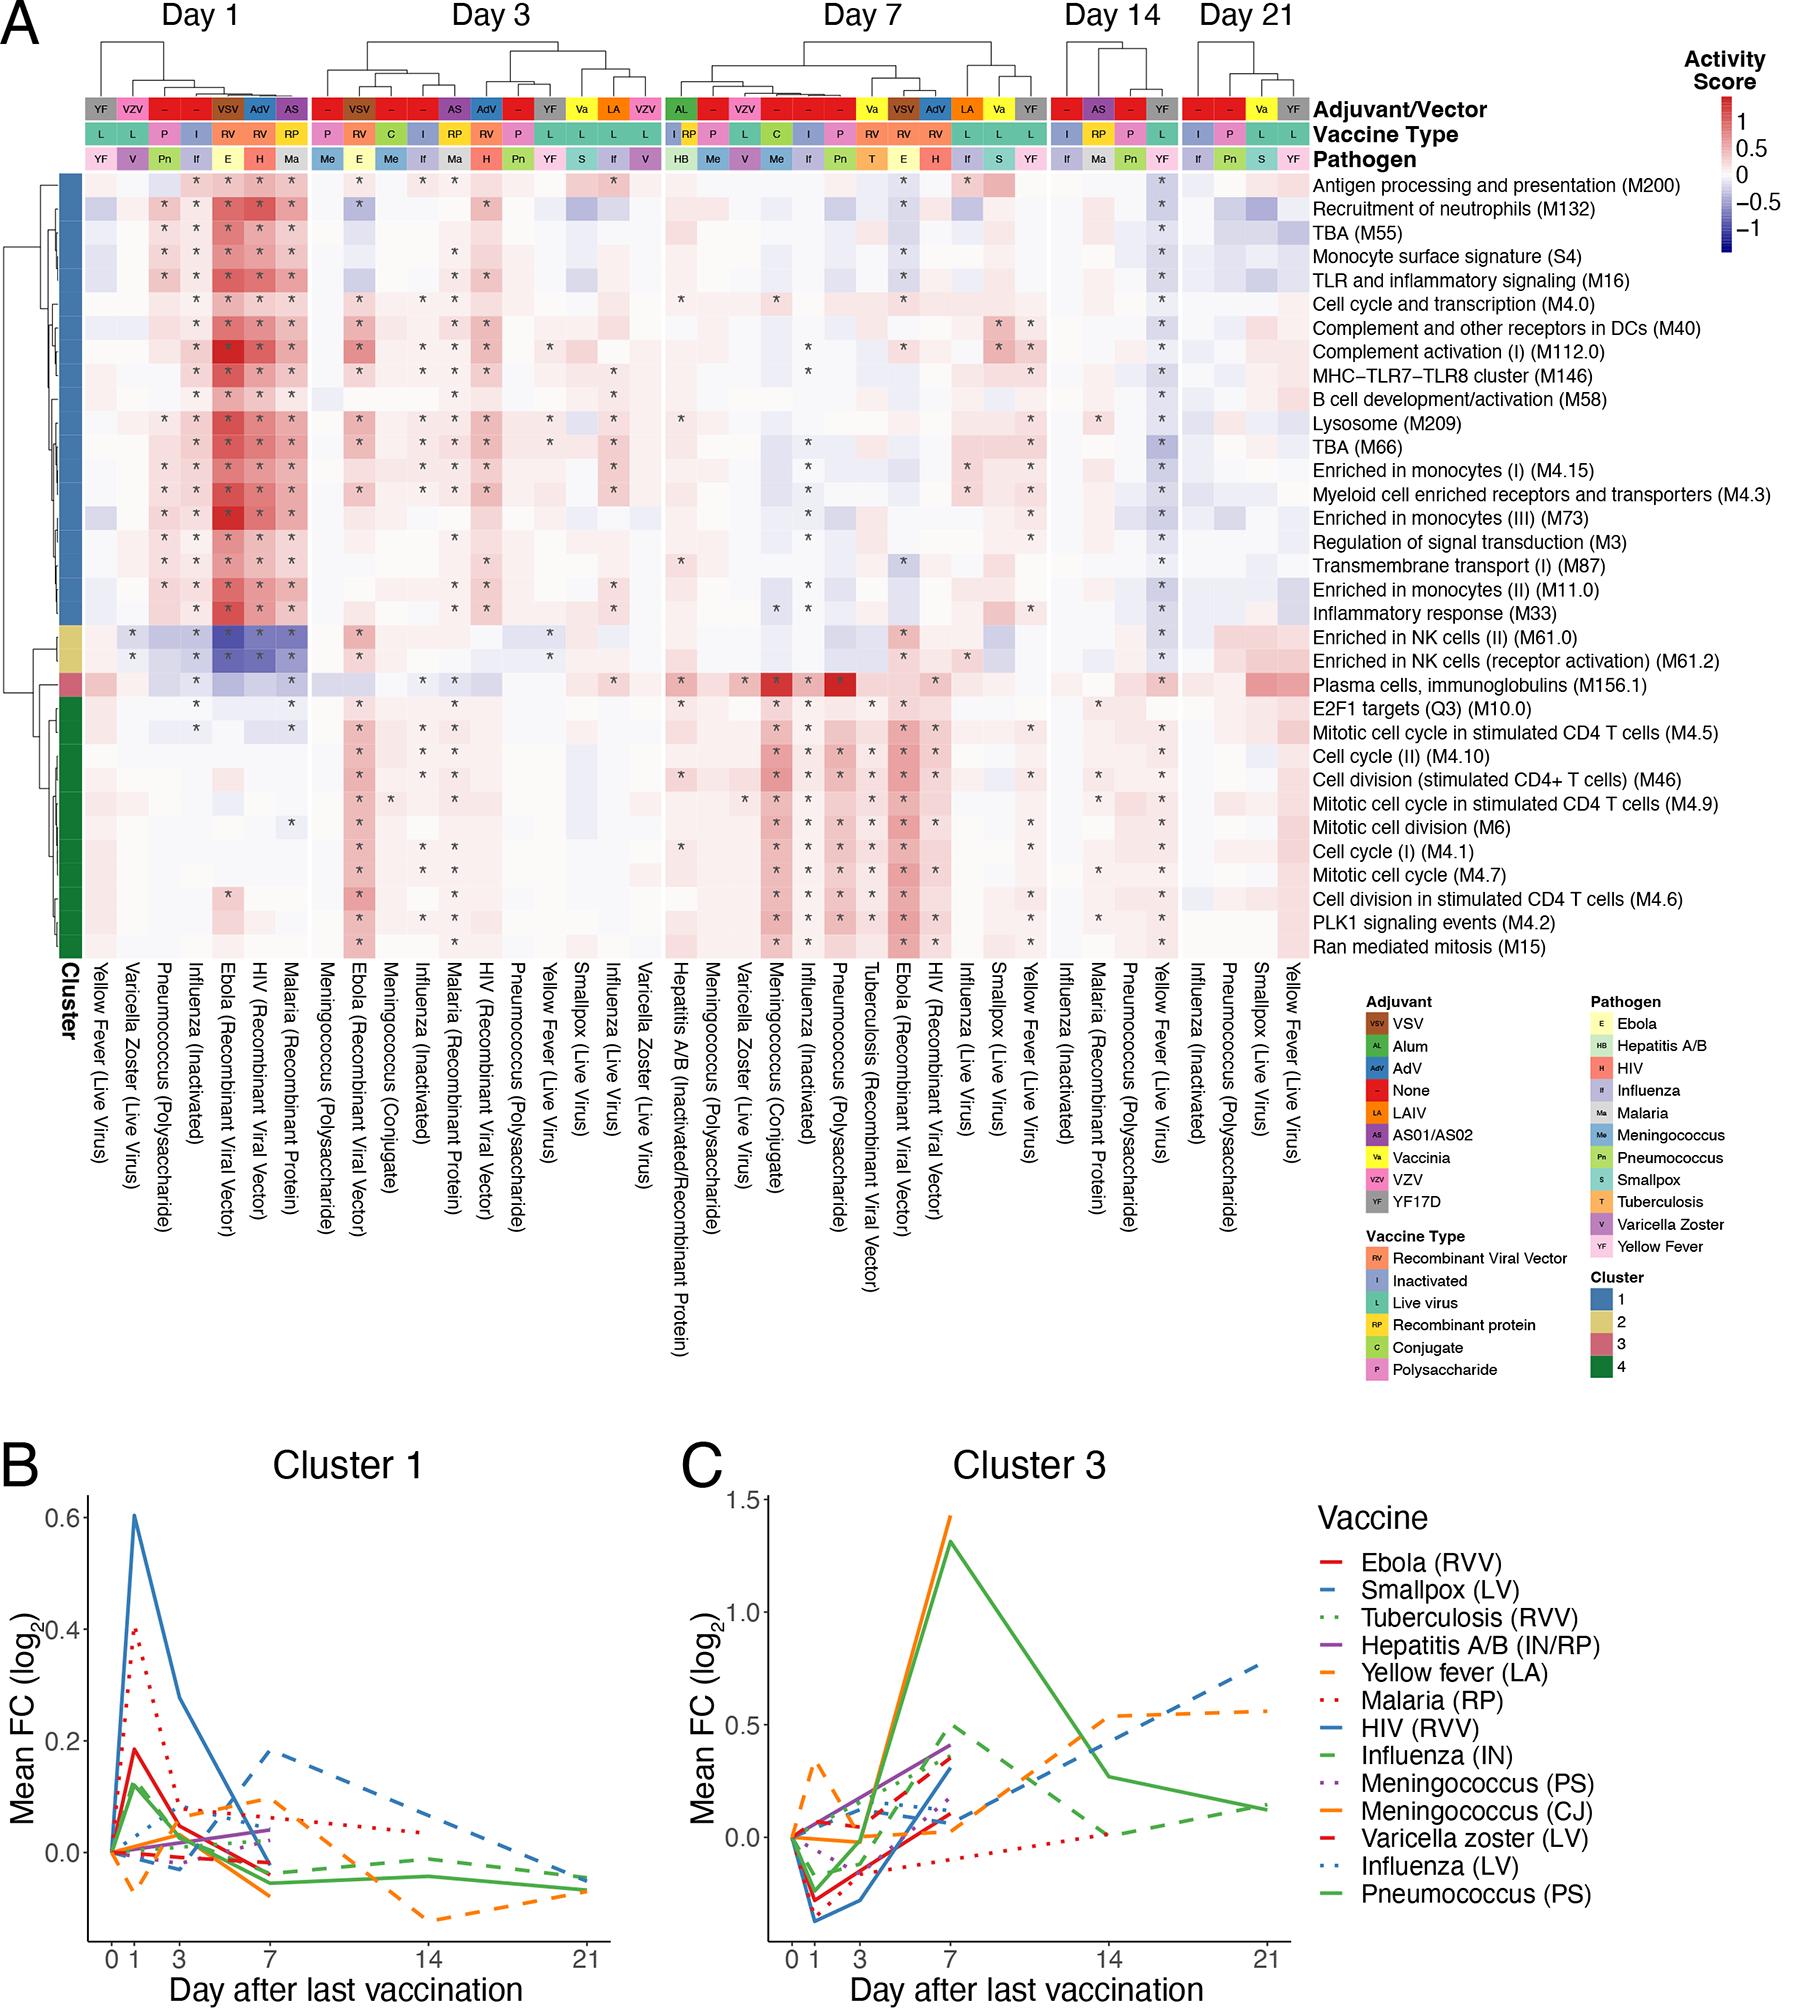
Figure 2. Common and unique transcriptional responses across different vaccines.

A) Heatmap of common differentially expressed modules (regulated in 7 or more vaccines) over time (*FDR<0.05). Color represents the QuSAGE activity score. Clustering on columns was performed separately for Days 1, 3, 7, 14, and 21 post-vaccination. TBA – To be annotated. B) Kinetics of the mean FC of cluster 1 modules across vaccines C) Kinetics of the mean FC of cluster 3 modules across vaccines.
