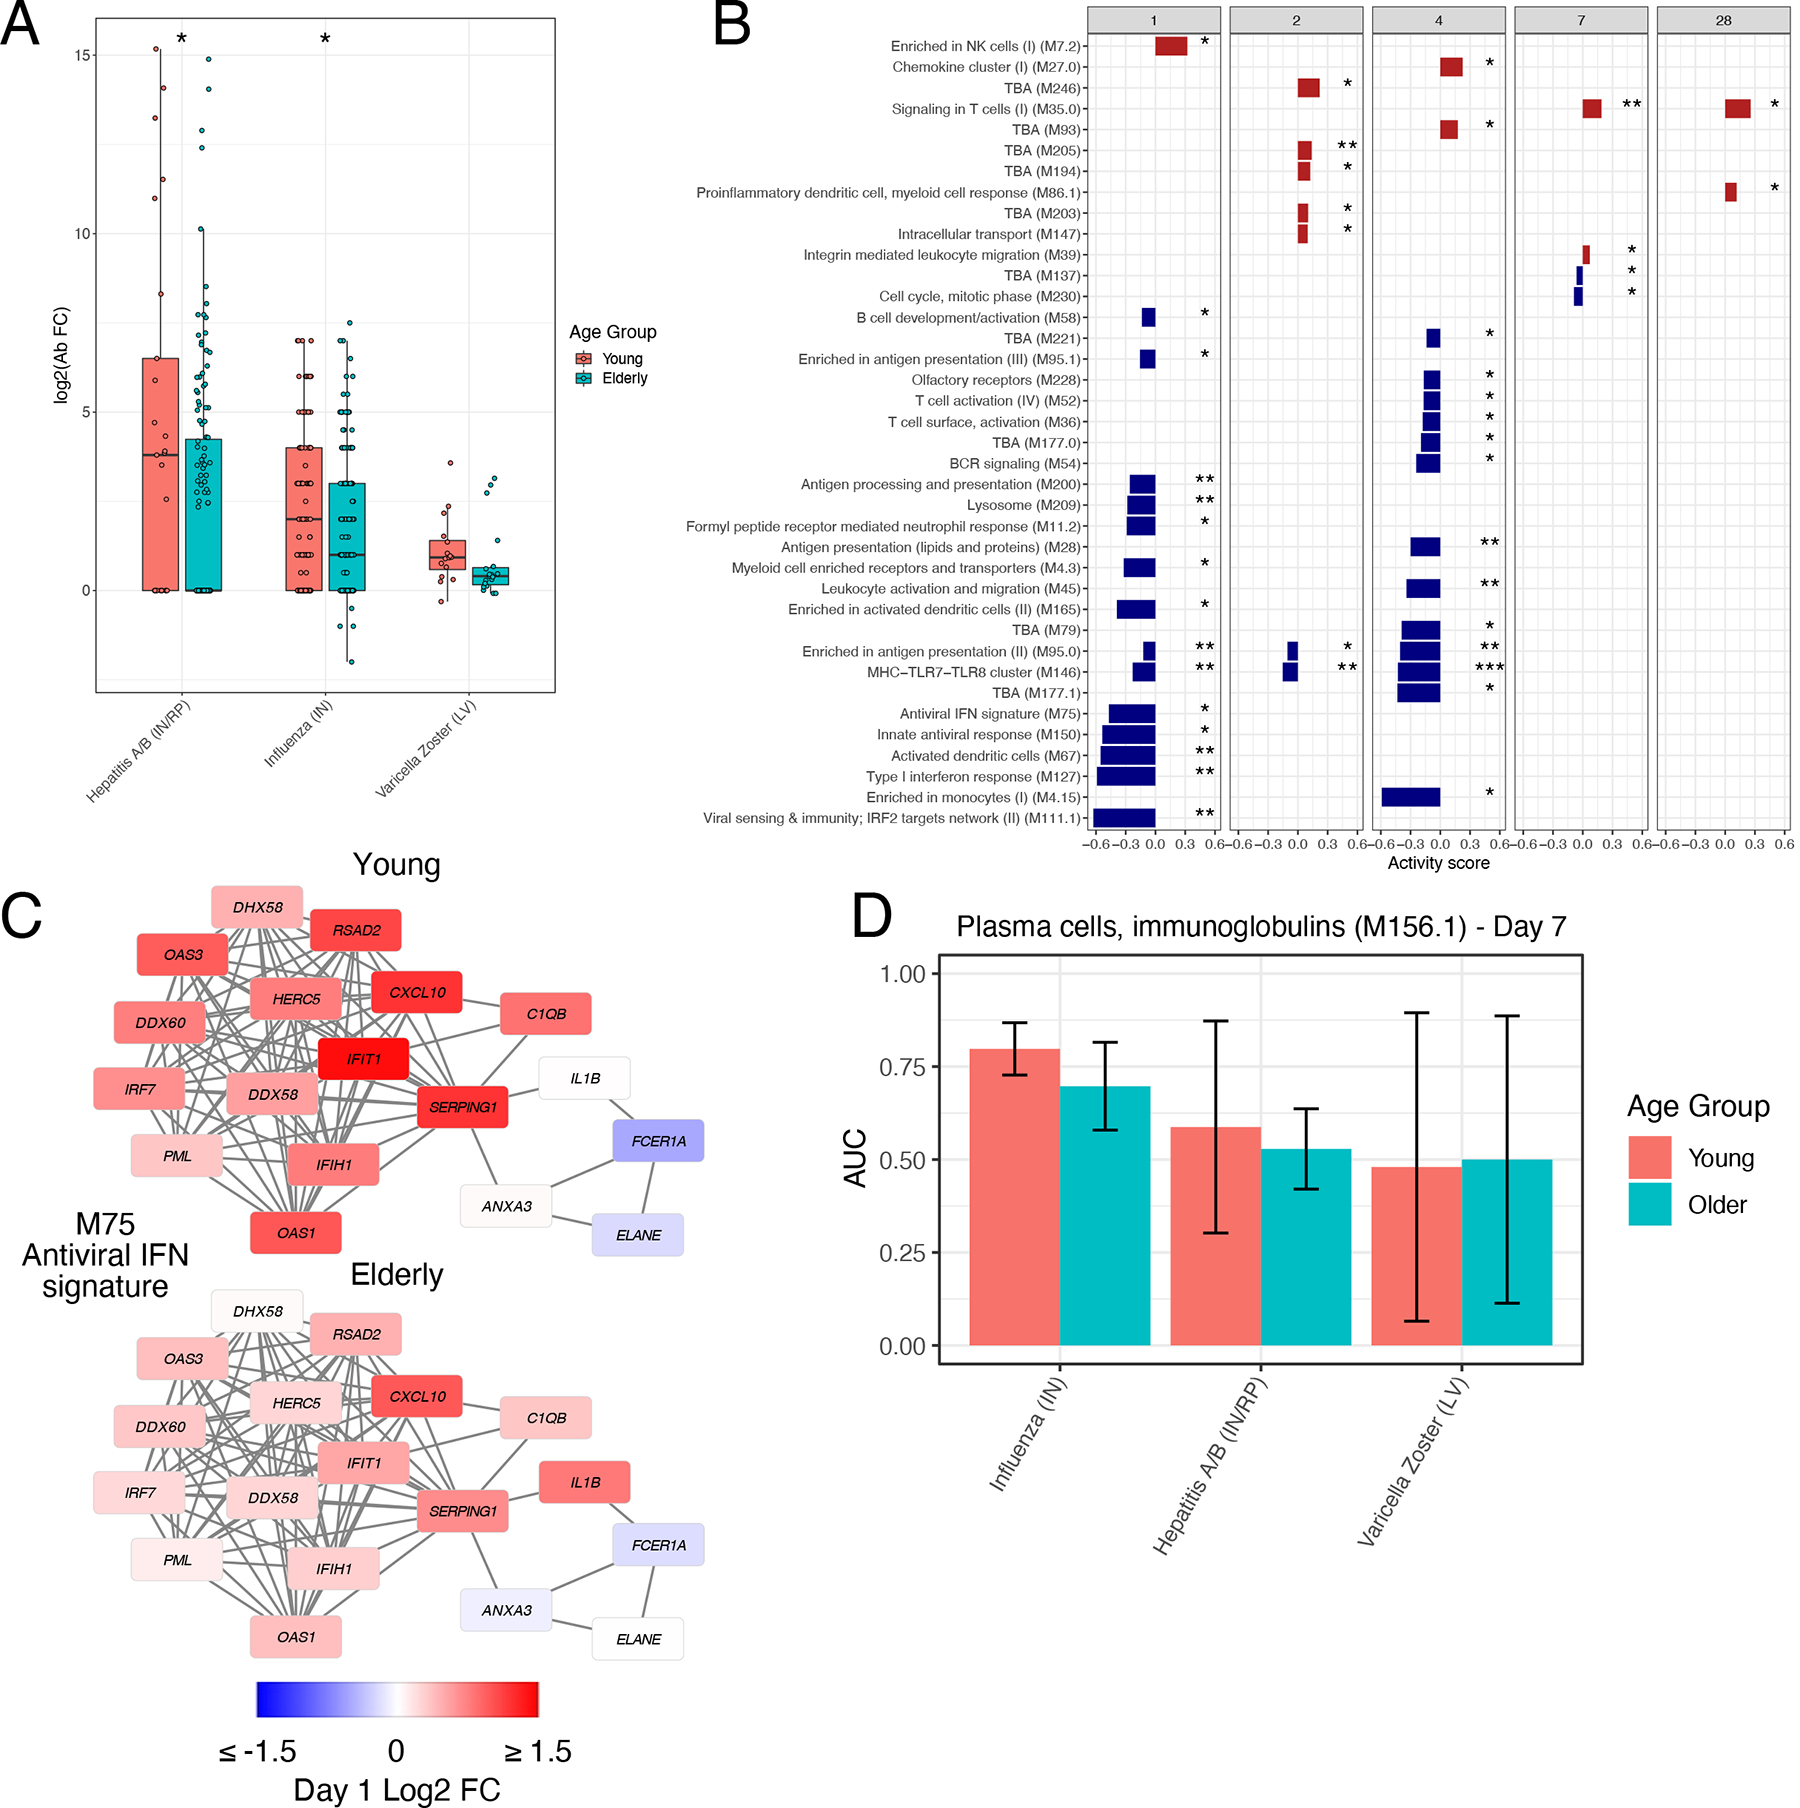
Figure 6. Impact of aging on transcriptional responses to vaccination.

A) Boxplots of Day 30 antibody responses to vaccination in young (≤50) and older (≥60) participants across vaccines. Center line, median; box limits, upper and lower quartiles; whiskers, 1.5x interquartile range. Hepatitis A/B (IN/RP) − Young: n=25, Hepatitis A/B (IN/RP) − Older: n=135, Influenza (IN) − Young: n=123, Influenza (IN) − Older: n=175, Varicella Zoster (LA) − Young: n=16, Varicella Zoster (LA) − Older: n=19. B) Modules differentially expressed between young and older participants in response to inactivated influenza vaccination (QuSAGE FDR<0.05). C) Network plot of module M75 on Day 1 following inactivated influenza vaccination in young and older participants. Each edge represents a co-expression relationship, as described in Li et al.10; colors represent the Day 1 log2 FC. D) Barplot of the Day 7 AUC of module M156.1 across vaccines in young and older participants. Data are presented as mean values +/− 95% confidence interval. n=2000 bootstrap replicates.
