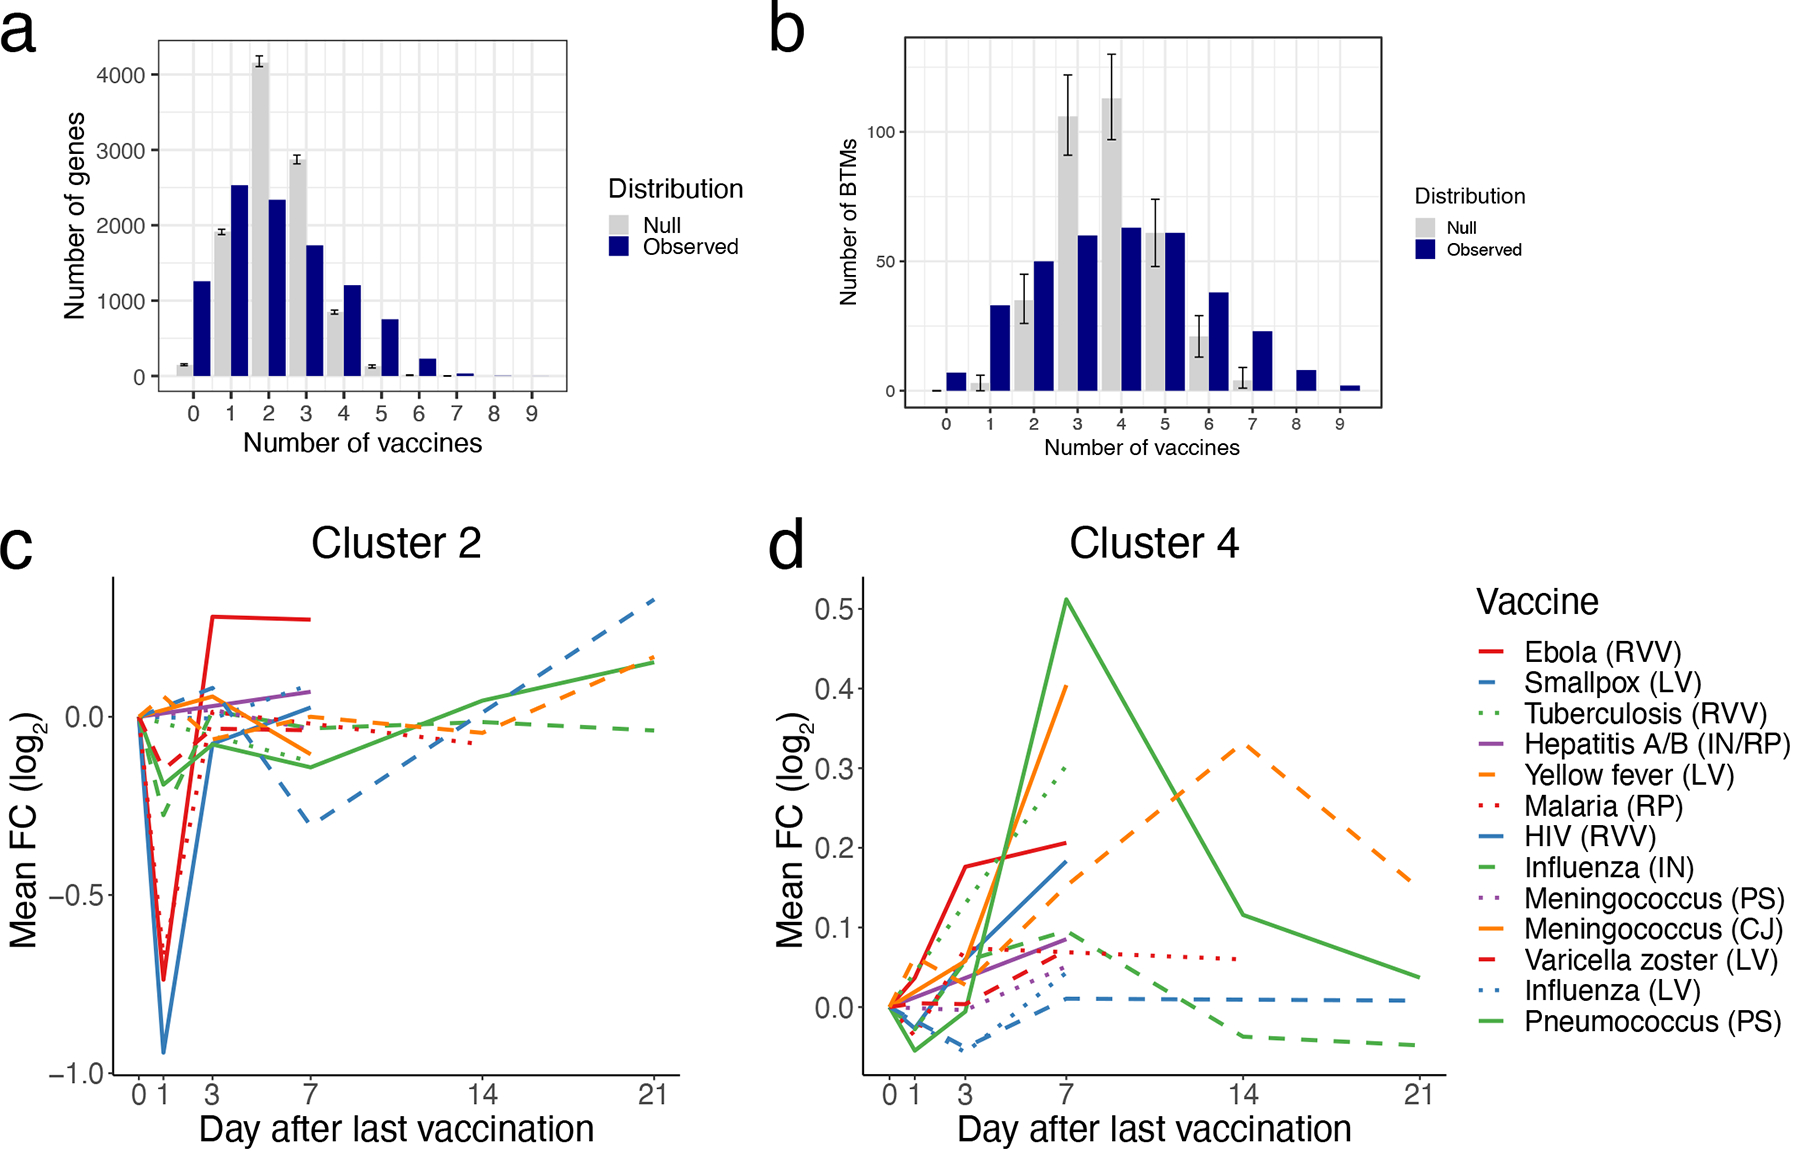
Extended Data Figure 1. Overlap in differentially expressed genes/modules and kinetics of common module clusters.

A-B) Histograms of overlap in DEGs (A) or differentially expressed modules (B) between vaccines. A gene/module is shared with another vaccine if it is significantly (FDR < 0.05) regulated in the same direction, irrespective of time point. Blue bars, number of genesets shared (y-axis) between the same number of vaccines (x-axis). Grey bars represent the null distribution generated by n=10,000 permutations of gene/module labels within vaccine + timepoint groups. Data are presented as mean values +/− 95% confidence interval. C) Kinetics of the mean FC of cluster 2 BTMs across vaccines. D) Kinetics of the mean FC of cluster 4 modules across vaccines.
