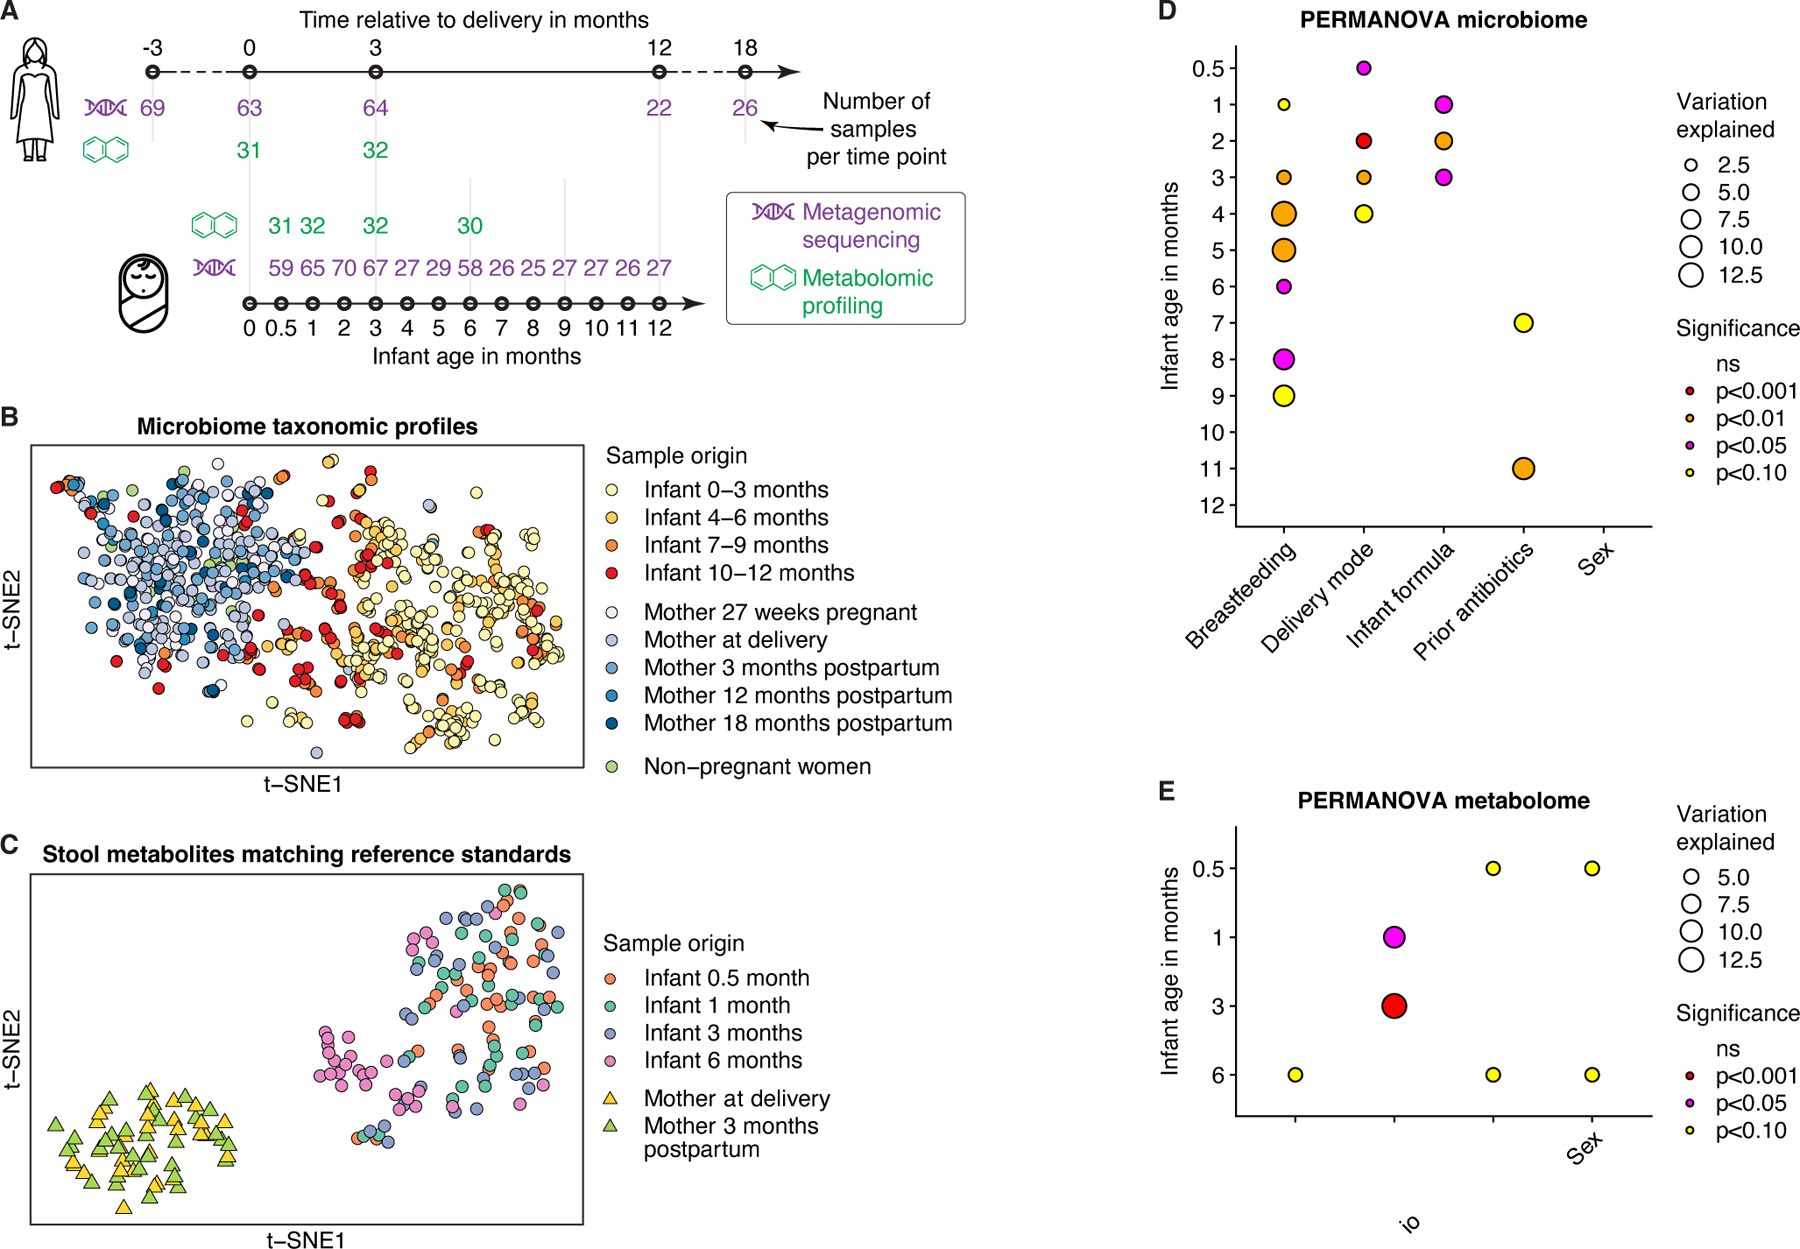
Figure 1. Multi-omic data from the EDIA cohort.

A) Schematic illustration of metagenomic and metabolomic data. Number of samples (n) after quality control at each time point is indicated. B) t-distributed stochastic neighbor embedding (t-SNE) ordination of gut microbiome profiles based on Bray-Curtis dissimilarities of species-level abundances from metagenomic data. C) t-SNE ordination of gut metabolite profiles based on log-scaled and z-score-normalized abundances of n=858 metabolites annotated using reference standards. D-E) Effects of factors on (D) species-level taxonomic composition (Bray-Curtis dissimilarities) and (E) metabolomic profiles (restricted to features annotated using standards) in infants according to cross-sectional PERMANOVA analyses. Factors were assessed in combination, while ordered by individual log10-transformed p-values from initial PERMANOVA analysis of each factor. ‘Infant formula’ comprises three categories: regular, hydrolyzed, and no formula. See also Figure S1; Tables S1-2.
