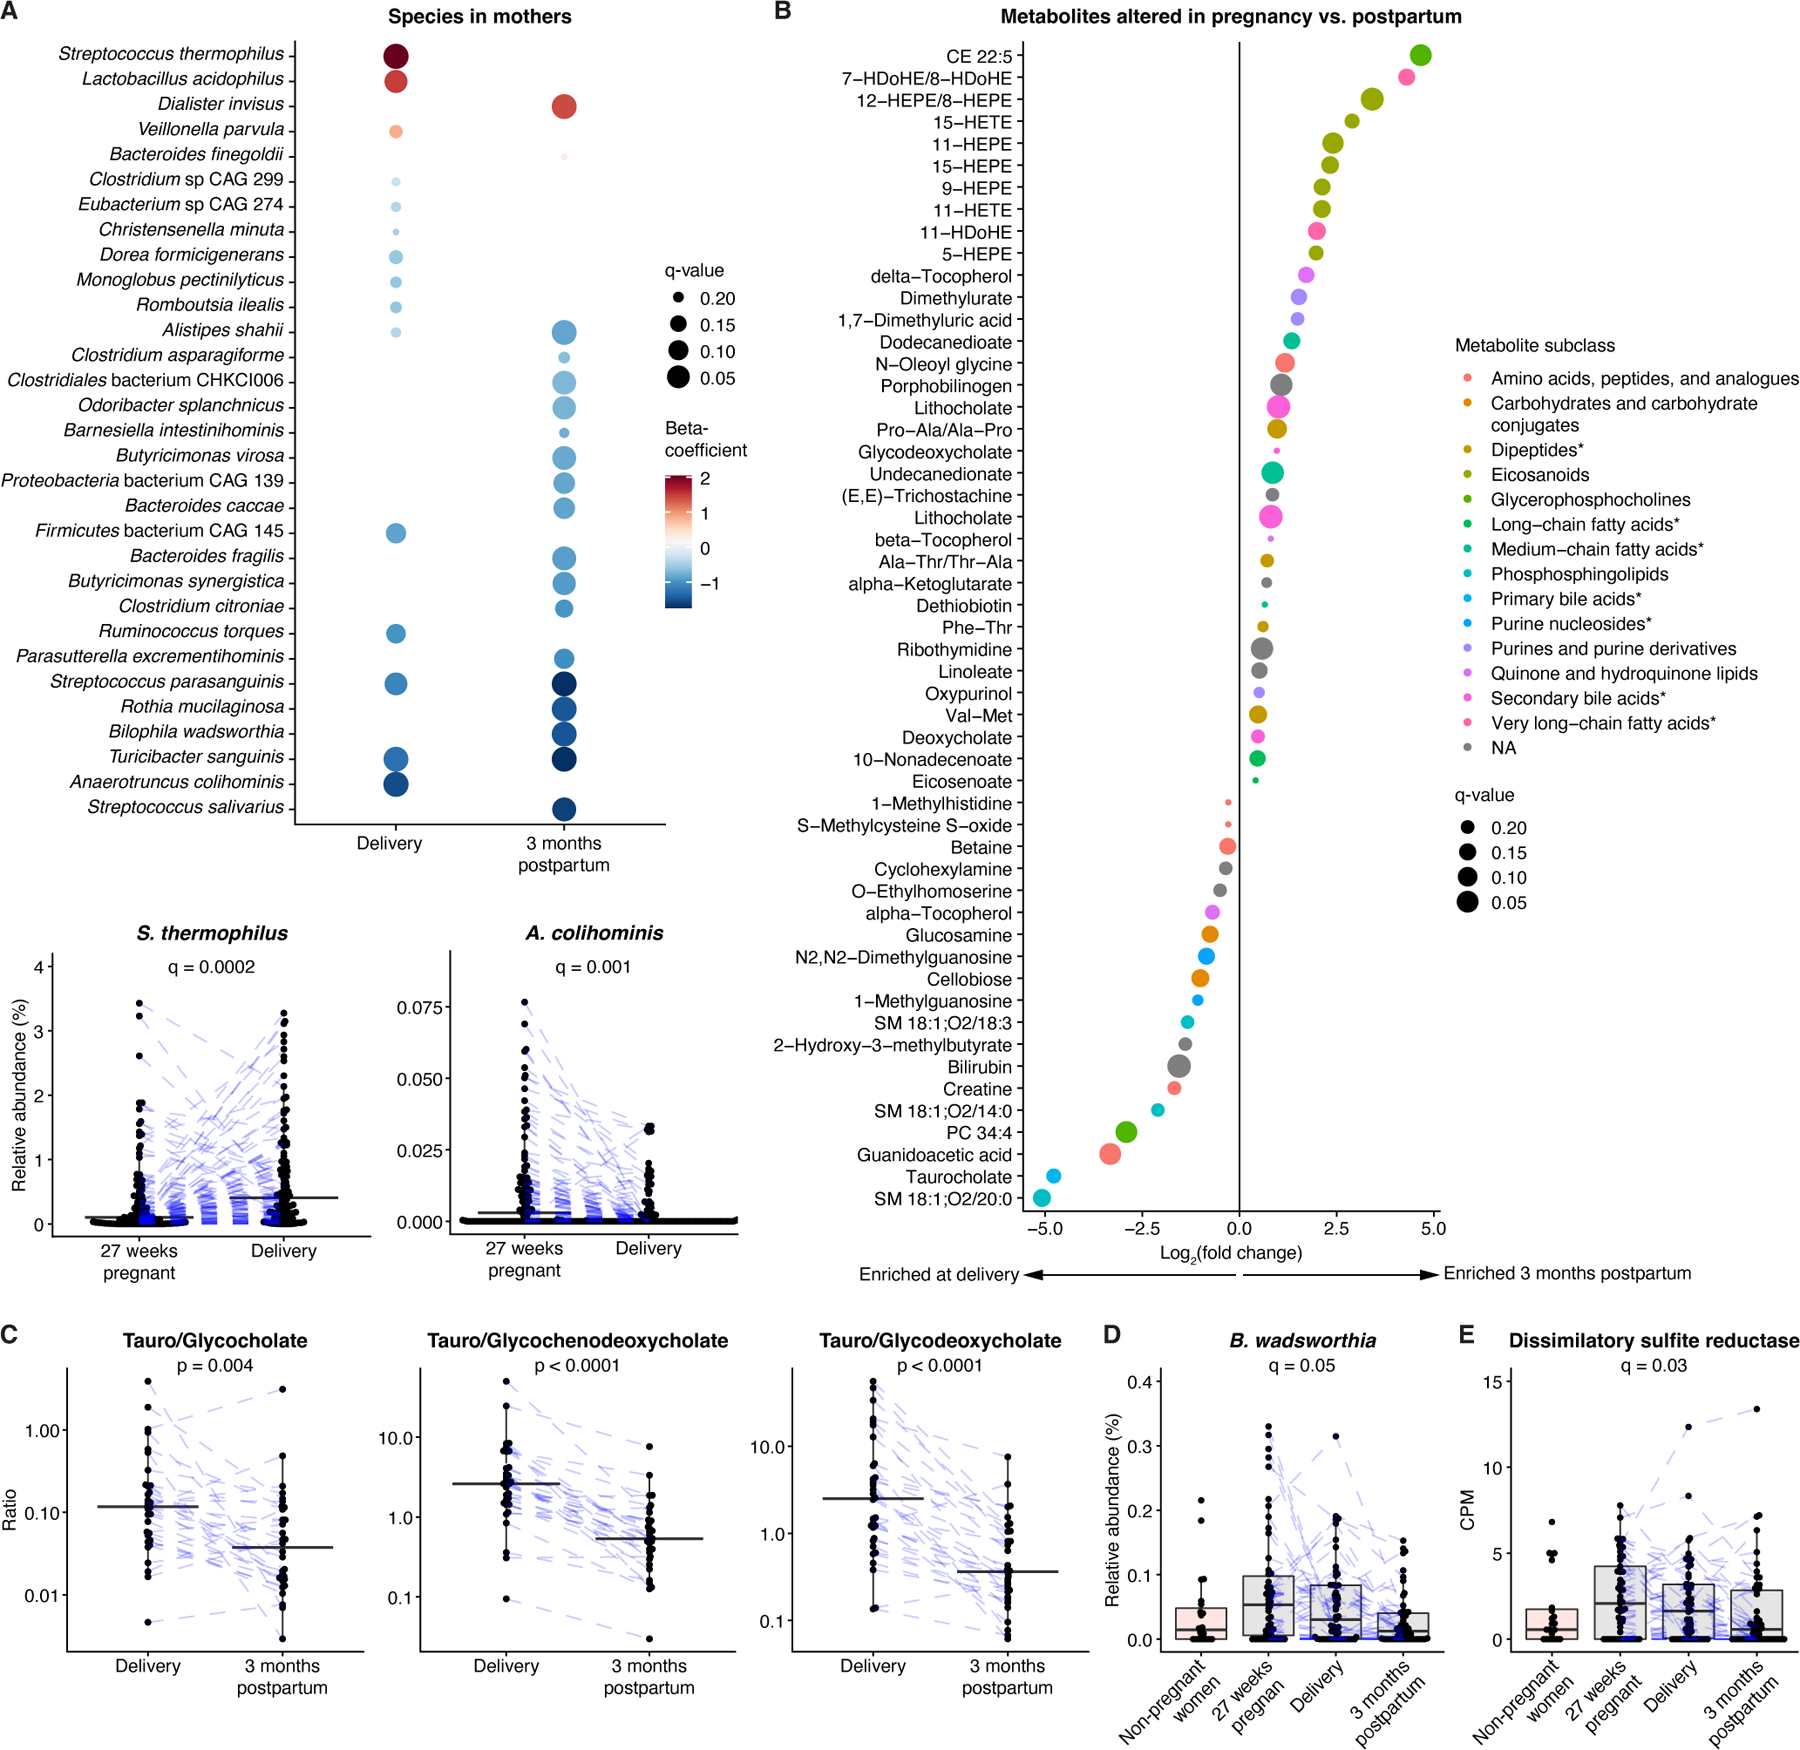
Figure 2. Metagenomic and metabolomic signatures during pregnancy included expansion of taurine-conjugated bile acids, Bilophila wadsworthia, and H2S production capacity.

A) Upper panel: Differences in species at delivery and 3 months postpartum compared to gestational week 27. Lower panels: For each boxplot, two high outliers are not shown (both from the delivery time point for S. thermophilus; one from gestational week 27 and one from the delivery time point for A. colihominis). B) Metabolomic differences in paired maternal samples from delivery and 3 months postpartum. Asterisks indicate that subclass identification was replaced by more specific identification. C) Relative expansion of taurine-versus glycine-conjugated bile acids at delivery compared to 3 months postpartum. p-values obtained by the Wilcoxon signed-rank test. D) B. wadsworthia expansion during pregnancy. One high outlier (delivery) is not shown. E) Dissimilatory sulfite reductase expansion during pregnancy. One high outlier (gestational week 27) is not shown. In (D, E) results from a non-pregnant female control group were included as a reference. q-values refer to comparisons of pregnancy and postpartum time points based on paired samples, after correction for longitudinal analysis. For boxplots, midlines represent the median, boxes the interquartile range (25th to 75th percentile), and whiskers the range of data. Blue lines connect data points from the same participant. CPM, copies per million. See also Figure S2; Table S1.
