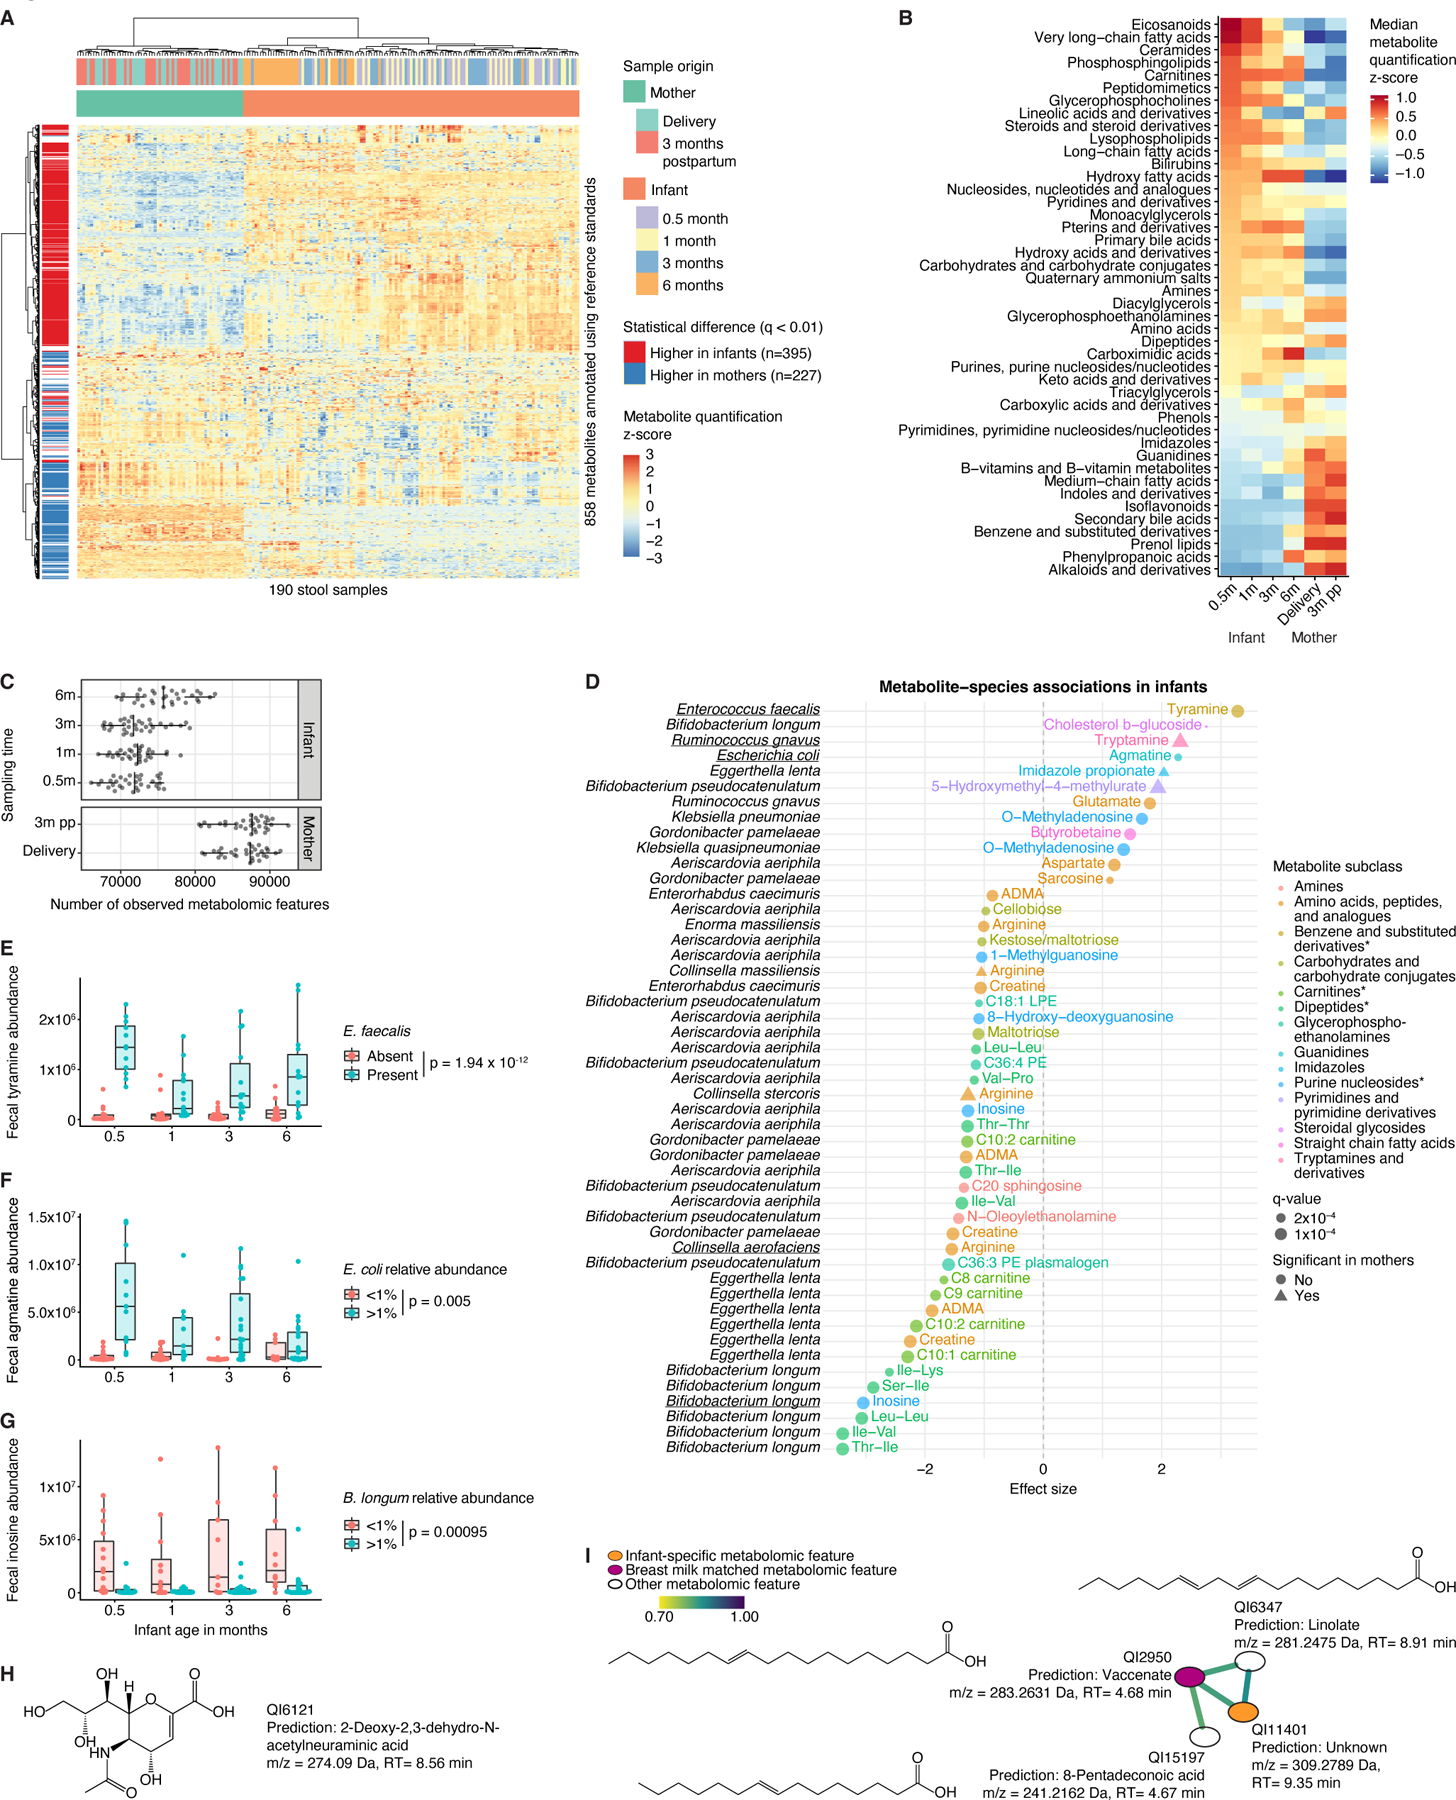
Figure 4. Unique metabolomic profiles of the infant gut.

A) Heatmap of n=858 metabolites annotated using reference standards in the infant and maternal gut. B) Median abundance of metabolite classes/subclasses (represented by at least three unique metabolomic features) stratified by sampling time point. C) Metabolomic diversity, measured as the number of observed metabolomic features, in mothers and their infants. D) Significant associations between infant species with >25% prevalence and metabolomic features (annotated by reference standards) after adjustment for longitudinal analysis and correction for infant age, sex, delivery mode, antibiotic usage, and formula use/type. Species-metabolite associations independently confirmed in prior in vitro experiments35 are underscored. Asterisks indicate that subclass identification was replaced by identification on another level. E) Fecal tyramine levels stratified by infant age and presence of Enterococcus faecalis. F) Fecal agmatine levels stratified by age and Escherichia coli relative abundance. G) Fecal inosine levels stratified by age and Bifidobacterium longum relative abundance. H) Chemical structure of infant-specific metabolomic feature QI6121 predicted with SIRIUS. m/z, mass-to-charge ratio; RT, retention time. I) GNPS subnetwork associated with infant-specific metabolomic feature QI11401. Edges connect metabolomic features with cosine similarity >0.7. Chemical structures predicted with SIRIUS. For boxplots, midlines represent the median, boxes the interquartile range (25th to 75th percentile), and whiskers the range of data. See also Figure S4; Tables S1, S5-6.
