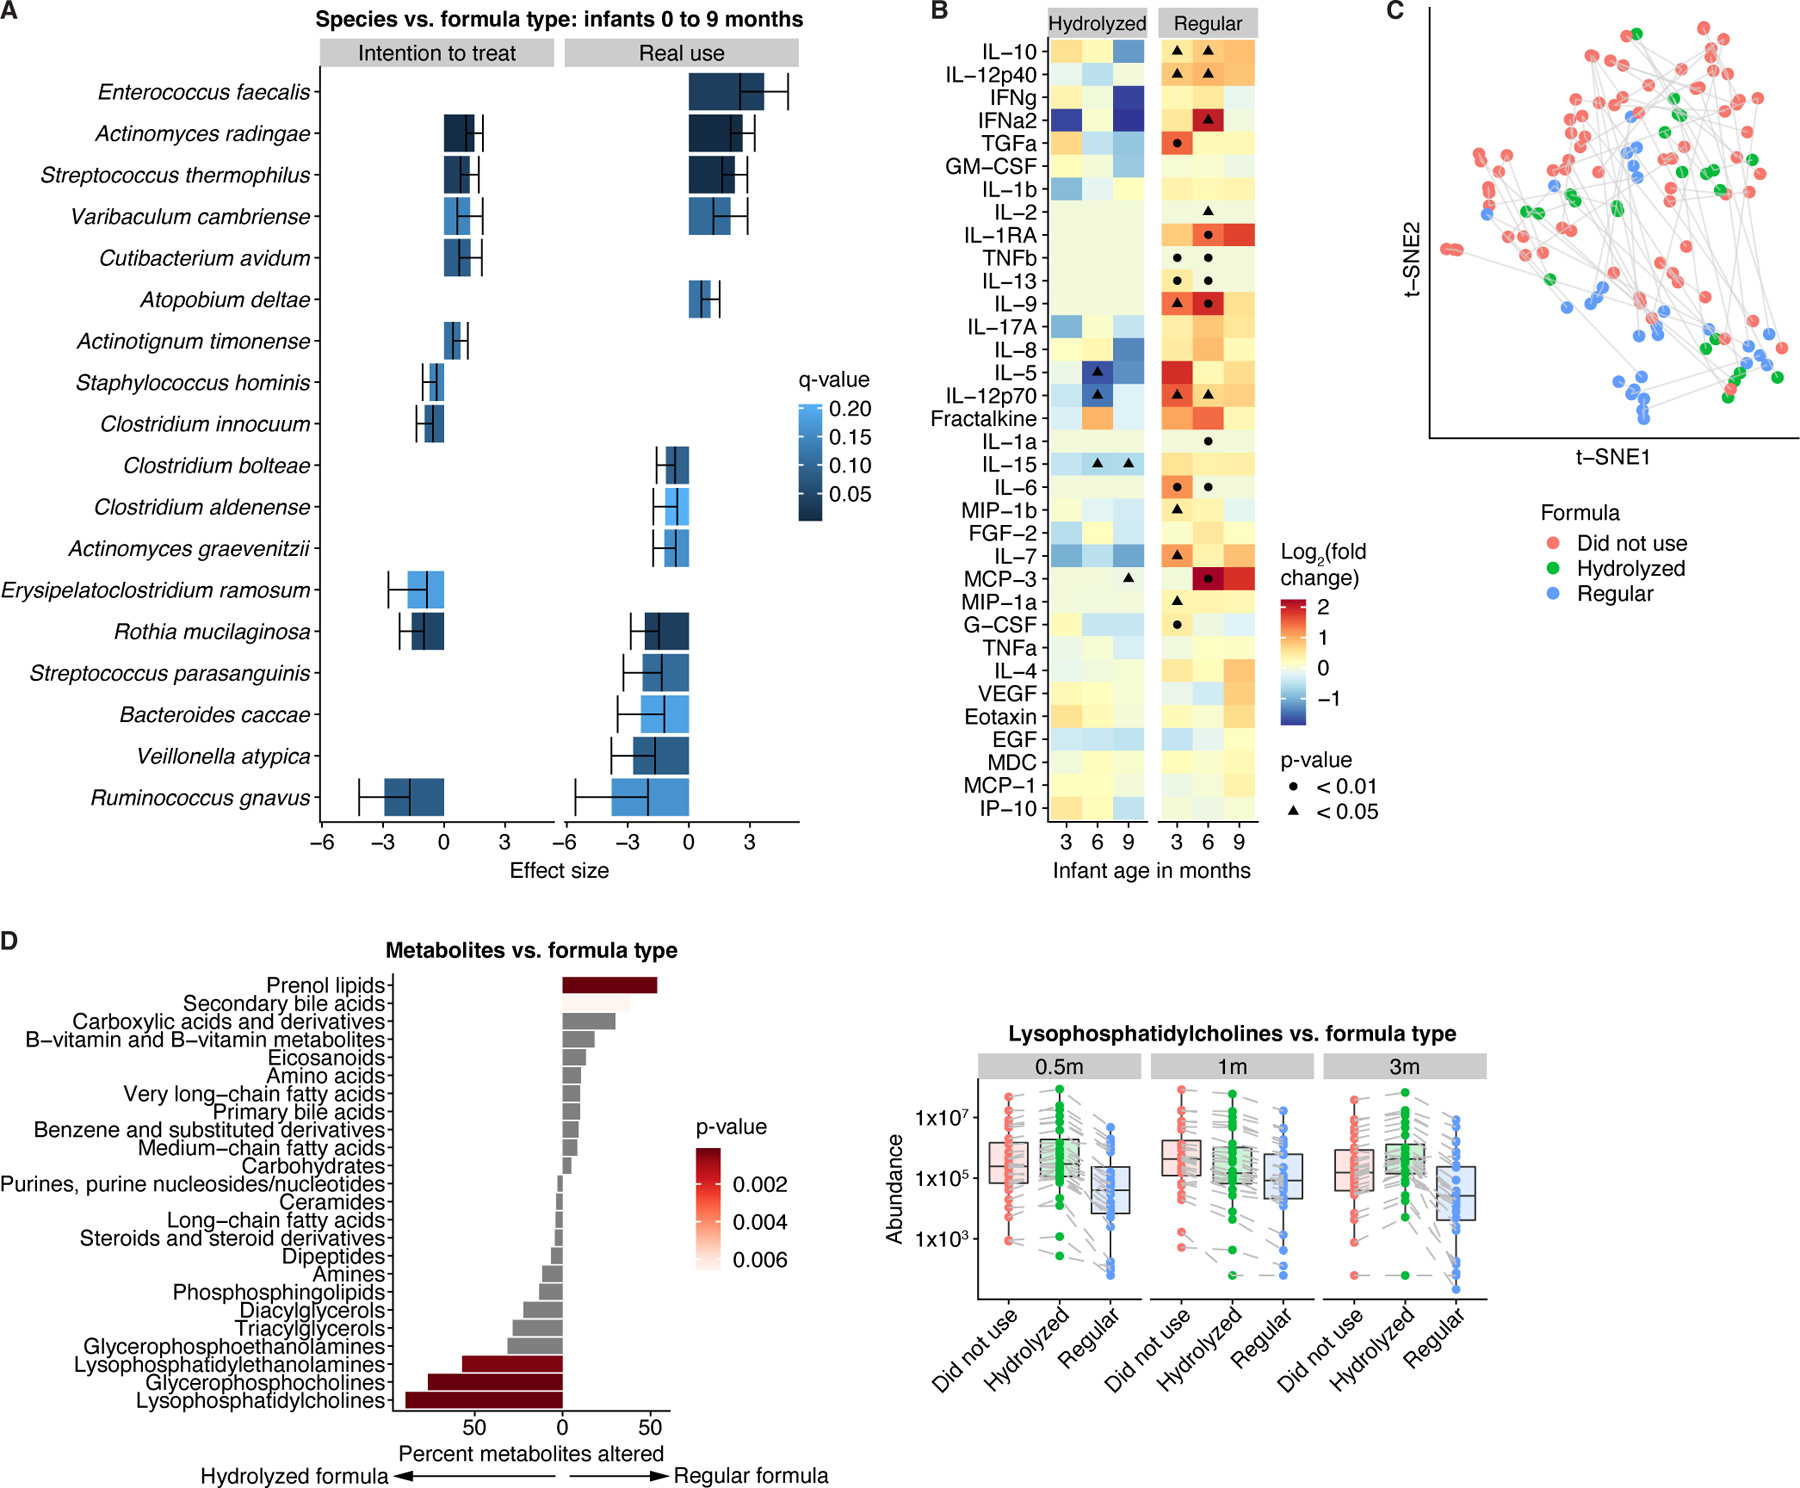
Figure 5. Formula types were associated with distinct metagenomic and metabolic profiles.

A) Species differences (q<0.25) between infants who were randomized to (left) or received (right) regular versus hydrolyzed formula. Results obtained from general linear models, adjusted for longitudinal analysis and corrected for age, sex, delivery mode, antibiotic usage, and breastfeeding. Error bars represent standard error. Positive effect sizes indicate species enriched in infants who were randomized to or received regular formula, while negative effect sizes indicate species enriched in infants who were randomized to or received hydrolyzed formula. B) Enrichment of proinflammatory cytokines in infants given regular versus no formula. p-values obtained by the Mann-Whitney U-test. C) t-SNE ordination of fecal metabolomics profiles in infants, colored by formula use/type. D) Left panel: Percentage of metabolites per subclass/category that were altered (q<0.25) between infants on hydrolyzed and regular formula for at least one time point. p-values obtained through Fisher’s exact test. Right panel: Median levels of lysophosphatidylcholines stratified by age and formula use/type. Lines connect identical metabolites. Midlines represent the median, boxes the interquartile range (25th to 75th percentile), and whiskers the range of data. See also Figure S5; Tables S1-2.
