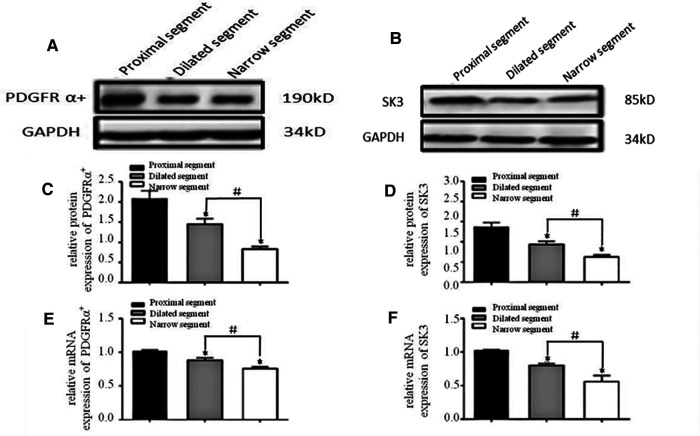
Figure 2.
mRNA and protein expressions of PDGFRα and SK3. (A,B): Electrophoresis identification. (C,D): Significant difference among the relative expressions of proteins in the three segments (narrow, dilated, and proximal). (E,F): mRNA expressions of PDGFRα and SK3 in the three segments. *P < 0.05 vs. proximal segment; #P < 0.05 dilated vs. narrow segments.

