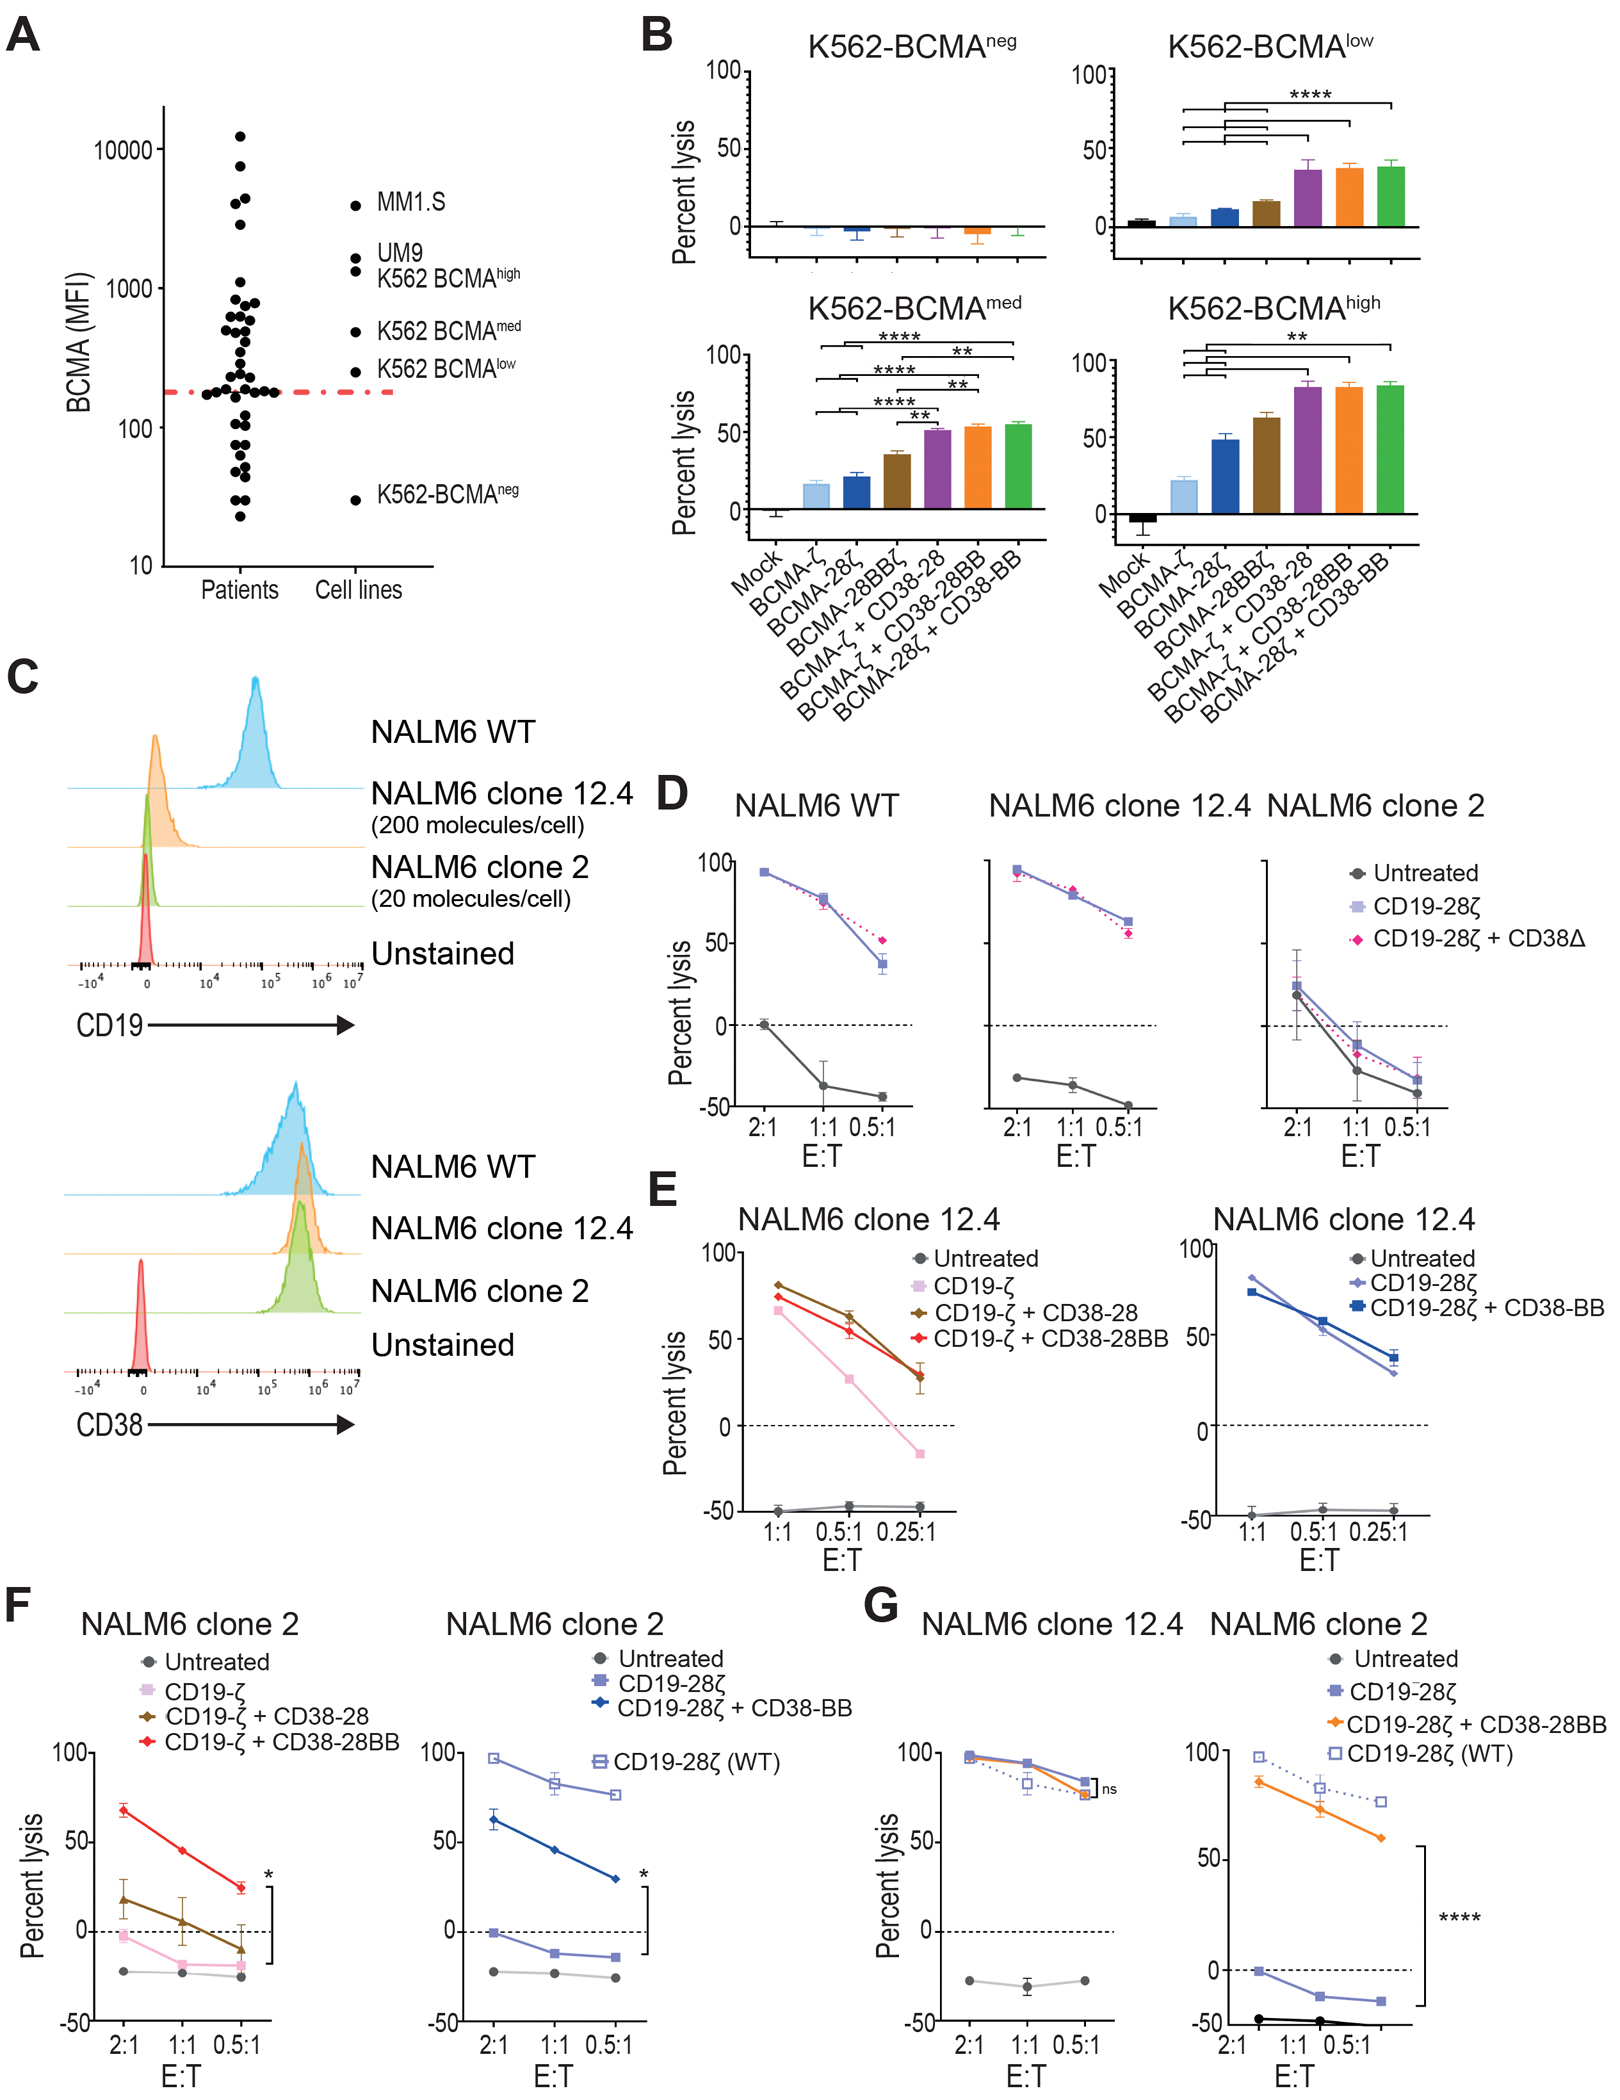
Figure 3. CAR and CCR combinations restore the cytotoxic capacity of T cells against low-antigen expressing tumor variants.

(A) Primary malignant plasma cells and cell lines were analyzed for BCMA expression by flow cytometry. Dot plots depict the MFI of BCMA found on primary MM tumor cells from 49 patients, in comparison with MM cell lines and K562 cells transduced to express BCMA in variant concentrations. The red line depicts median MFI for primary MM cells. (B) K562 cells with different BCMA expression were co-cultured with first, second, or third generation BCMA-CAR T cells and double BCMA-CAR+CD38-CCR T cells (BCMA-ζ+CD38-28BB or BCMA-28ζ+CD38-BB) at 1:1 effector to target ratio. Cell lysis was determined at 16 hours by BLI (n=3 per group). Statistical analysis performed with a two-way ANOVA and subsequent multiple comparison, corrected by Turkey test. **p<0.01, ****p<0.0001. (C) Histograms of CD19 and CD38 expression are shown for the NALM6 acute lymphoblastic leukemia cell line (WT) and on two NALM6 clones (clone 12.4 and clone 2). The red histogram shows the unstained control. (D) Specific lysis of NALM6 WT, clone 12–4 (200 molecules per cell), and NALM6 clone 2 (20 molecules per cell) is shown when cell lines were co-cultured with CD19-28ζ or double CD19-28ζ+CD38Δ T cells. (E) Specific lysis of NALM6 clone 12-4 (200 molecules per cell) is shown when cocultured with CD19-ζ, double CD19-ζ+CD38-28, or double CD19-ζ+CD38-28BB T cells (left) or with CD19-28ζ or double CD19-28ζ+CD38-BB (right) T cells. (F) Specific lysis of NALM6 clone 2 is shown when co-cultured with CD19-ζ, double CD19-ζ+CD38-28, or double CD19-ζ+CD38-28BB T cells (left) or with CD19-28ζ or double CD19-28ζ+CD38-BB (right) T cells. The open squares represent the lysis activity of the CD19 wild type NALM6 cell line when treated with CD19-28ζ CAR T cells. Statistical analysis was performed with using two-way ANOVAs and subsequent multiple comparison, corrected by Turkey test. *p<0.05. (G) Specific cytolysis of NALM6 clone 12-4 (200 molecules per cell) and NALM6 clone 2 (20 molecules per cell) is shown when cells were cocultured with CD19-28ζ or double CD19-28ζ+CD38-28BB T cells at indicated E:T ratios. The open squares represent the lysis activity of the CD19 WT NALM6 cell line when treated with CD19-28ζ CAR T cells. Statistical analysis was performed using two-way ANOVA and subsequent multiple comparison, corrected by Turkey test. ****p<0.0001.
