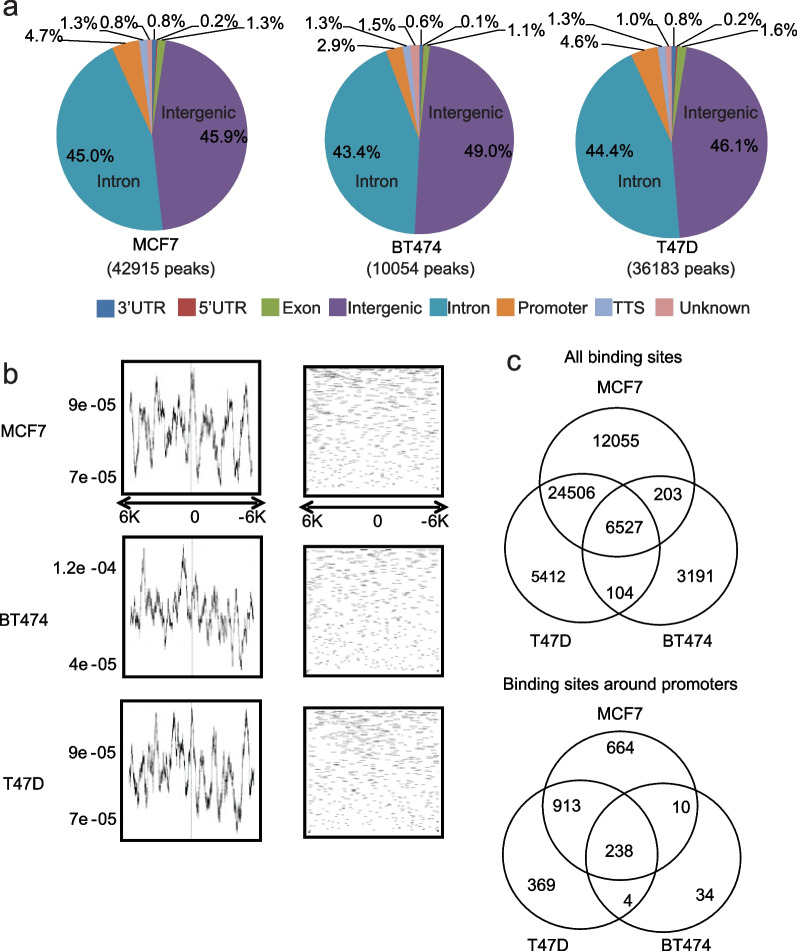
Fig. 1.
GRHL2 ChIP-seq in luminal breast cancer cells. a Percentage of GRHL2 binding sites found at promoter regions, 5′ untranslated regions (UTRs), 3′ UTRs, exons, introns, intergenic regions, transcription termination sites (TTSs) and unknown regions in the indicated luminal breast cancer cell lines. Promoter regions are defined as − 1000 to + 100 bp from the transcription start sites (TSS). b Read count frequency and density profile of GRHL2 binding sites within − 6000 to + 6000 bp of the TSS. Left panels show GRHL2 ChIP-seq read count frequencies in indicated cell lines (Y axis, read count frequency; X axis, genomic region). Right panels show density of ChIP-seq reads for GRHL2 binding sites in the indicated cell lines. c Venn diagrams showing overlap of GRHL2 binding sites among the three indicated cell lines. Top panel shows overlap for all peaks. Bottom panel shows overlap for peaks within the − 1000 to + 100 promoter region

