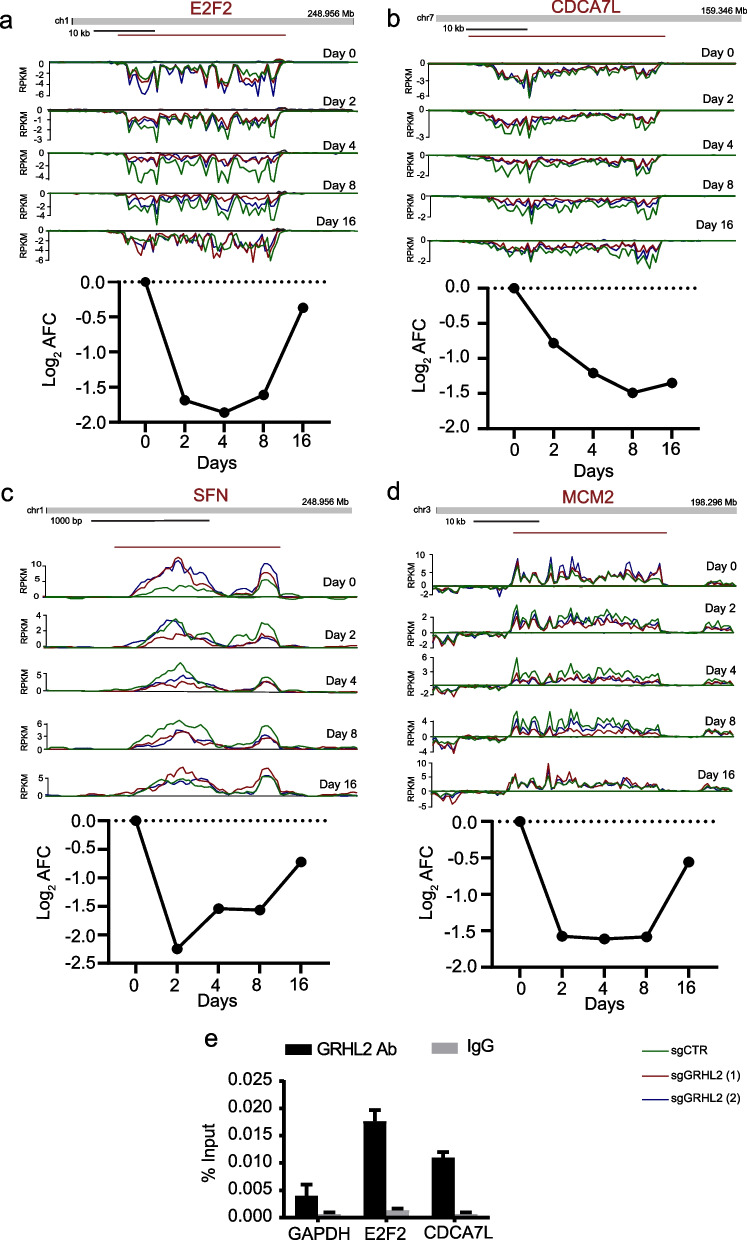
Fig. 5.
Downregulation of RNA synthesis for genes involved in cell cycle progression after GRHL2 loss. a–d Top: Bru-seq reads for indicated genes at indicated time point after to GRHL2 deletion. Track colors: green, sgCTR; red, sgGRHL2(1); blue, sgGRHL2(2). Bottom: Line graphs depicting the log2 AFC of transcription in sgGRHL2(1) and sgGRHL2(2) cells for the indicated genes. The positive y-axis indicates the plus-strand signal of RNA synthesis from left to right and the negative y-axis represents the minus-strand signal of RNA synthesis from right to left. e Validation of interaction of GRHL2 binding sites with the promoter regions of indicated genes by ChIP-qPCR. Signals for IgG control and GRHL2 antibody pulldown samples are normalized to input DNA and are presented as % input with SEM from 3 technical replicates. Data are statistically analyzed by t-test and *indicates p < 0.05

