Fig. 6.
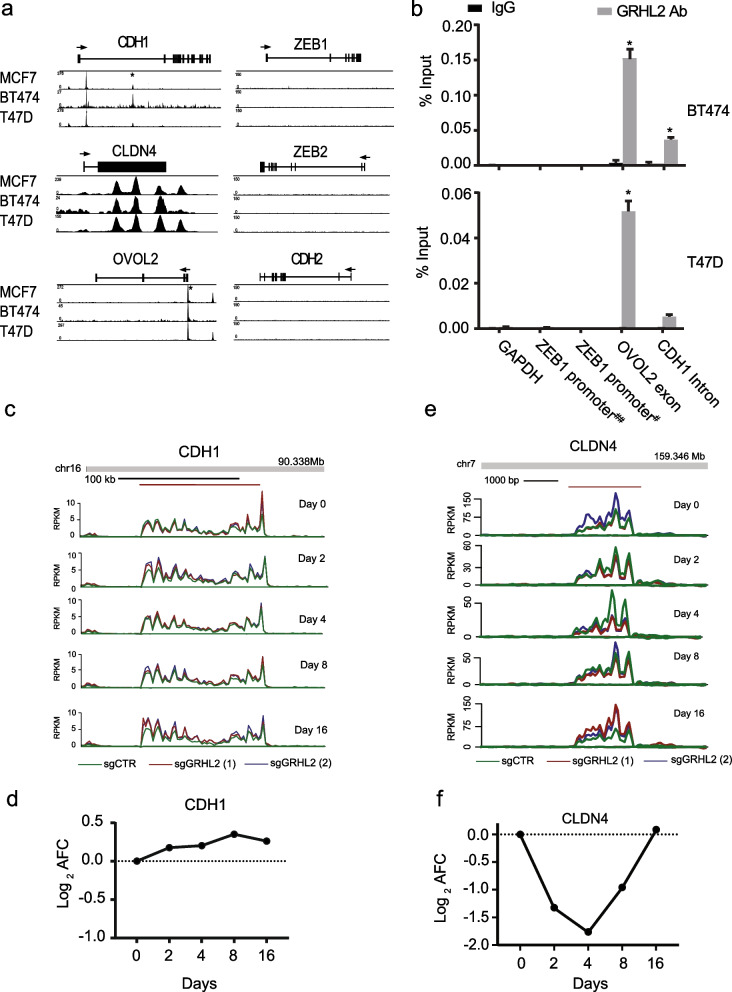
Regulation of EMT related genes by GRHL2. a ChIP tracks for the indicated genes in three luminal breast cancer cell lines. The track height is scaled from 0 to the indicated number. The locus with its exon/intron structure is presented above the tracks. *Indicates binding sites validated by ChIP-qPCR in (b). b ChIP-qPCR validation of presence and absence of GRHL2 binding sites identified by ChIP-seq. Graphs represent the efficiency of indicated genomic DNA co-precipitation with anti-GRHL2 Ab (grey bars) or IgG control Ab (black bars). Note enrichment of GRHL2 binding at OVOL2 exon and CDH1 intron, but not at ZEB1 promoter regions. For ZEB1 detection, ChIP-qPCR was performed using primers that have been previously reported to amplify ZEB1 promoter DNA sequences bound by GRHL2 in human mammary epithelial cells and in PEO1 but not OVCA429 human ovarian cancer cells (indicated by ##) [17, 23] and another primer set that did not confirm GRHL2 promoter interaction in ovarian cancer cells (indicated by #) [17]. Signals for IgG control and GRHL2 antibody pulldown samples were normalized to input DNA and presented as % input with SEM from 3 technical replicates. Data were statistically analyzed by t-test and * indicates p < 0.05. c, e Bru-seq reads for indicated genes at indicated time point after to GRHL2 deletion. Track colors: green, sgCTR; red, sgGRHL2(1); blue, sgGRHL2(2). d, f Line graphs depicting the log2 AFC of transcription in sgGRHL2(1) and sgGRHL2(2) cells for the indicated genes. The positive y-axis indicates the plus-strand signal of RNA synthesis from left to right and the negative y-axis represents the minus-strand signal of RNA synthesis from right to left

