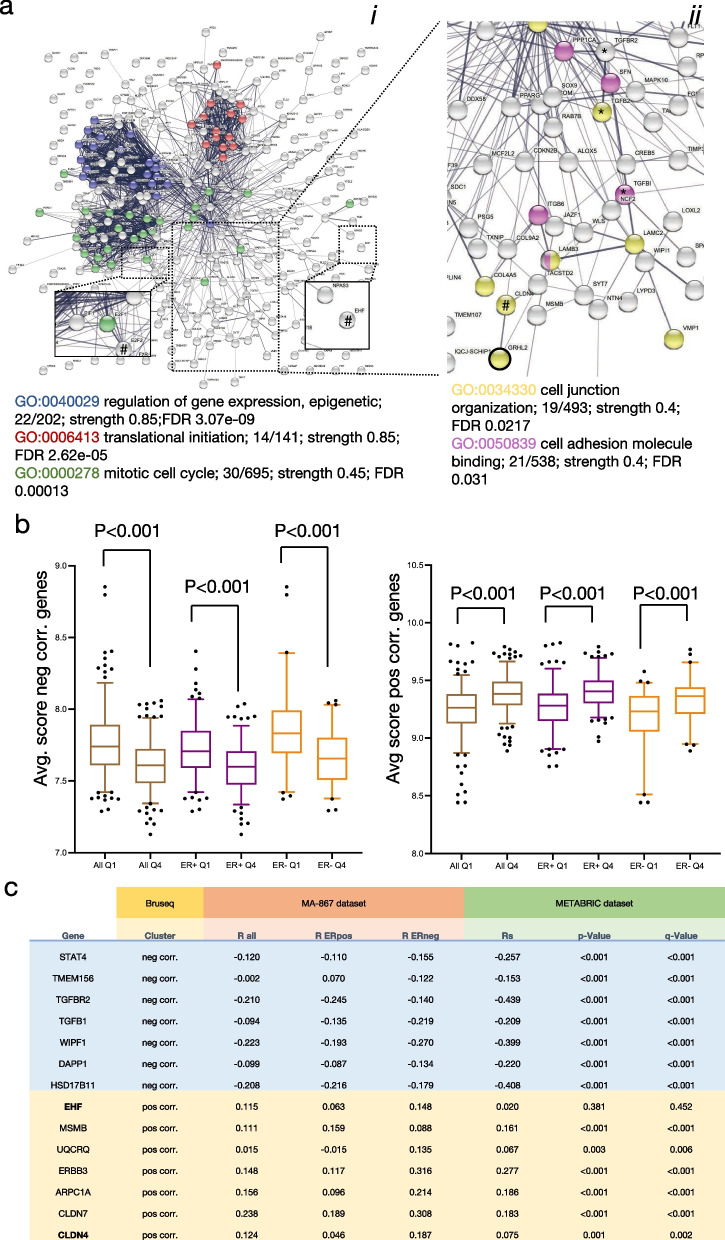
Fig. 7.
Gene clusters responding to GRHL2 depletion and their correlation with GRHL2 in breast cancer tissues. a STRING derived protein interaction analysis of genes displaying sustained up- or down regulation in response to GRHL2 depletion in MCF7. GO terms are color marked as indicated. i, entire network with boxes showing zoom-in on indicated regions; ii, zoom in on indicated region showing different GO terms. # Indicates GRHL2 targets identified by promoter binding. *Indicates TGFß signaling axis. b Average expression (log2 scale) in the MA-867 patient dataset of the cluster of genes negatively (left panel) or positively associated with GRHL2 (right panel) in MCF7 KO model. Patients were divided in 4 quartiles according to the level of GRHL2 expression. Q1, lowest GRHL2 expression; Q4, GRHL2 highest expression; All, all patients grouped together; ER + , ER positive patients grouped; ER-, ER negative patients grouped. Boxplots display the median with 25–75th percentile and dots represent lower 5% and upper 95% samples. p values determined by t test (two-sided). c Correlation with GRHL2 in MA-867 and METABRIC datasets for indicated genes negatively or positively correlated with GRHL2 in MCF KO model analyzed by Bru-seq. For MA-867 dataset, R-values for all patients grouped together, ER positive patients, or ER negative patients are shown. For METABRIC dataset, correlation, p-value, and q-values are shown as determined in BioPortal

