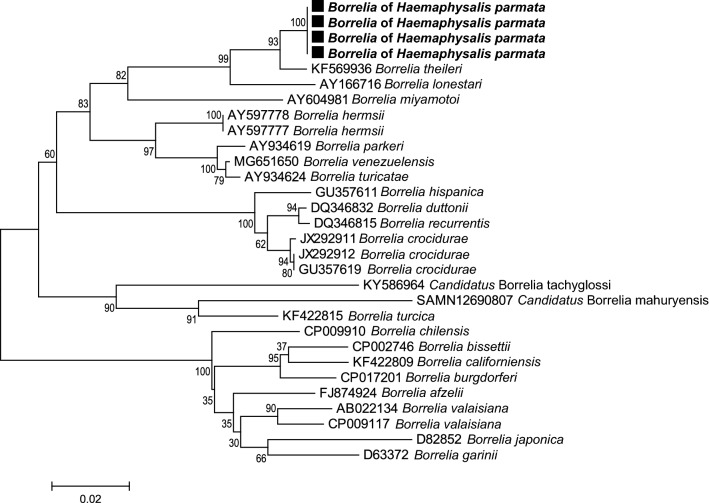
Fig. 6.
Borrelia phylogenetic tree constructed using maximum-likelihood (ML) estimations based on flaB nucleotide sequences (438 unambiguously aligned bp; best-fit approximation for the evolutionary model: T92 + G), including representative Borrelia species (their GenBank accession numbers are indicated on the tree). Branch numbers indicate percentage bootstrap support (1000 replicates). Only bootstrap supports > 70% are shown. The scale bar is in units of substitution/site. Black squares indicate Borrelia sequences obtained in this study

