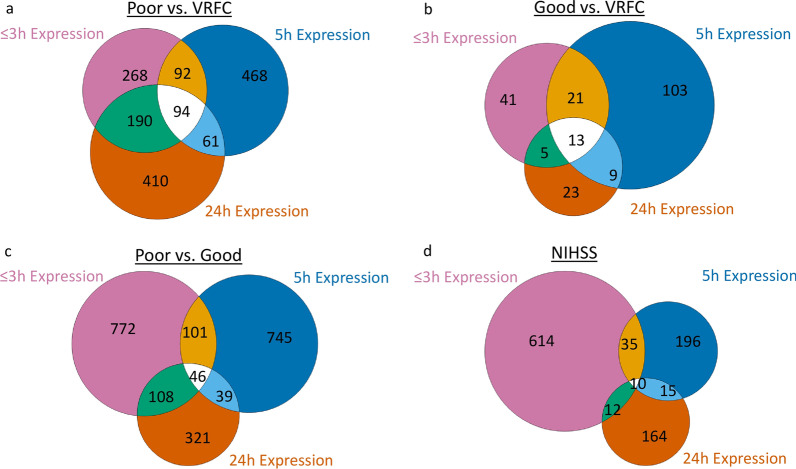
Fig. 4.
Venn diagram of the number of differentially expressed (DE) probe sets at each of the three time-points (≤ 3 h, 5 h and 24 h) post-stroke. a Numbers of DE probe sets between ischemic stroke (IS) participants with poor 90-day mRS outcomes compared vascular risk factor controls (VRFC). b Numbers of DE probe sets between IS participants with good 90-day mRS outcome compared to VRFC. c Numbers of DE probe sets between participants with poor 90-day mRS outcome compared to participants with good 90-day mRS outcome. d Numbers of DE probe sets that correlated with the 90-day National Institutes of Health Stroke Scale (NIHSS)

