
2.
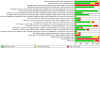
Risk of bias graph: review authors' judgements about each risk of bias item presented as percentages across all included studies. White spaces in this figure represent instances where it was not possible to make a judgement regarding objective or non‐objective outcomes.