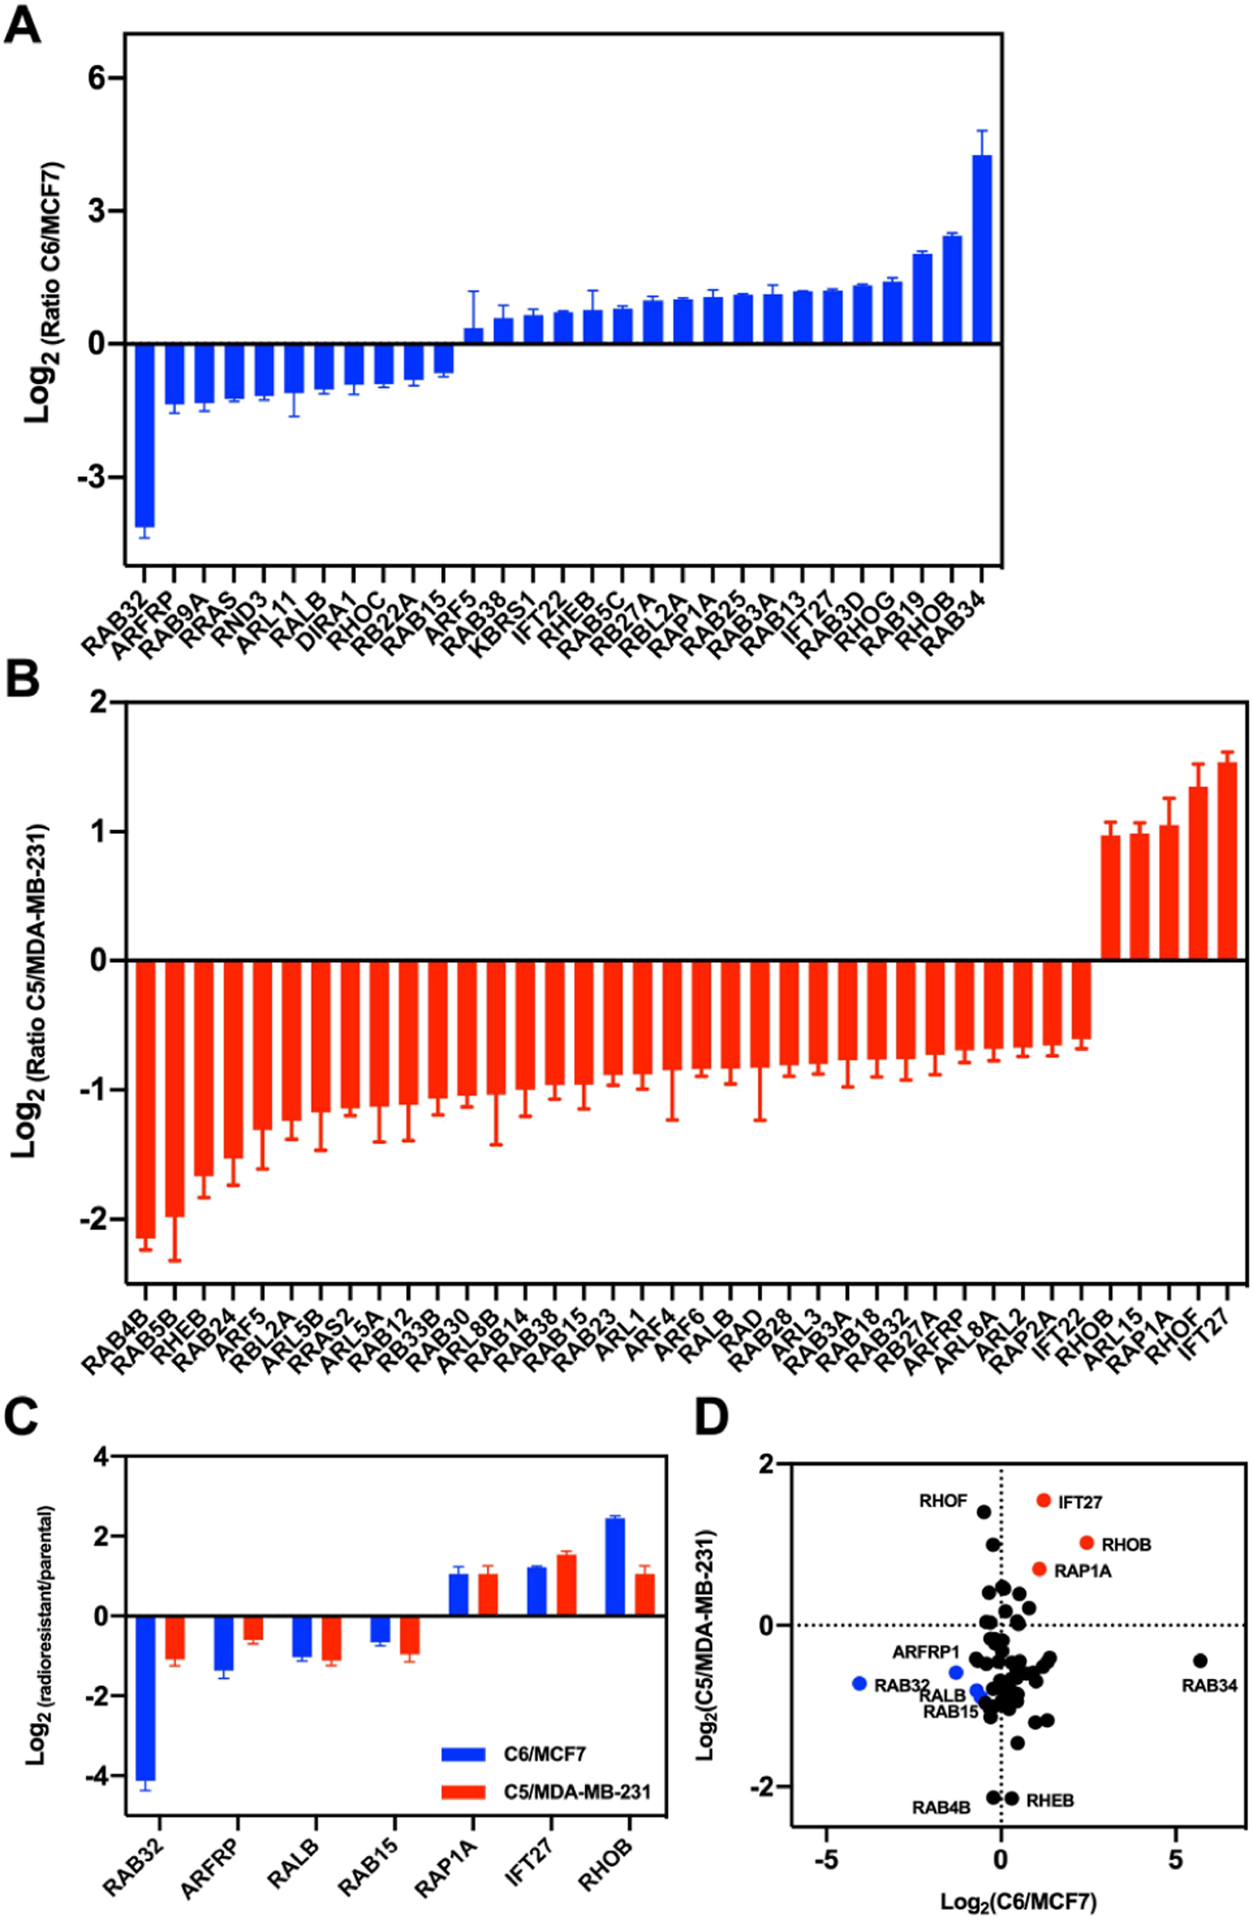
Figure 2.

Quantification of differential expression of small GTPases in MDA-MB-231/C5 and MCF7/C6 pairs of breast cancer cells. (A,B) Bar graphs showing the MRM quantification results of small GTPases with differences in expression being over 1.5-fold in radioresistant/parental pairs. (C) A bar graph illustrating the proteins commonly altered in the two pairs of radioresistant/parental breast cancer cell lines. Relative expression level is plotted as Log2 ratio of radioresistant/parental cells. (D) A scatter plot illustrating significantly up- and downregulated small GTPases in the two pairs of breast cancer cells. Seven commonly altered small GTPases are highlighted in red (for upregulated small GTPases in radioresistant cell lines) and blue (for downregulated small GTPases).
