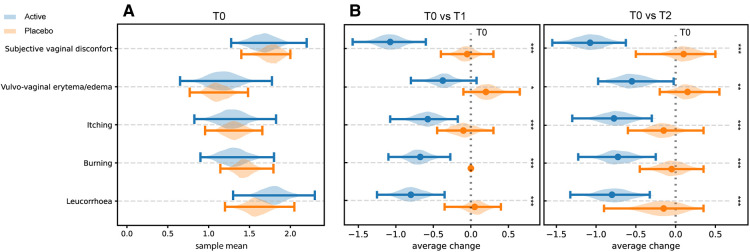
Figure 2.
Perception of clinical symptoms. Distribution of the bootstrapped mean values related to the score obtained by the assessment of the intensity of clinical signs and symptoms at T0 in both groups (Panel A). Differences in the distribution of mean values T1 and T2 compared with T0 in the two different groups (Panel B). * = p ≤ 0.05, ** = p ≤ 0.01, *** = p ≤ 0.001.

