
FIGURE.
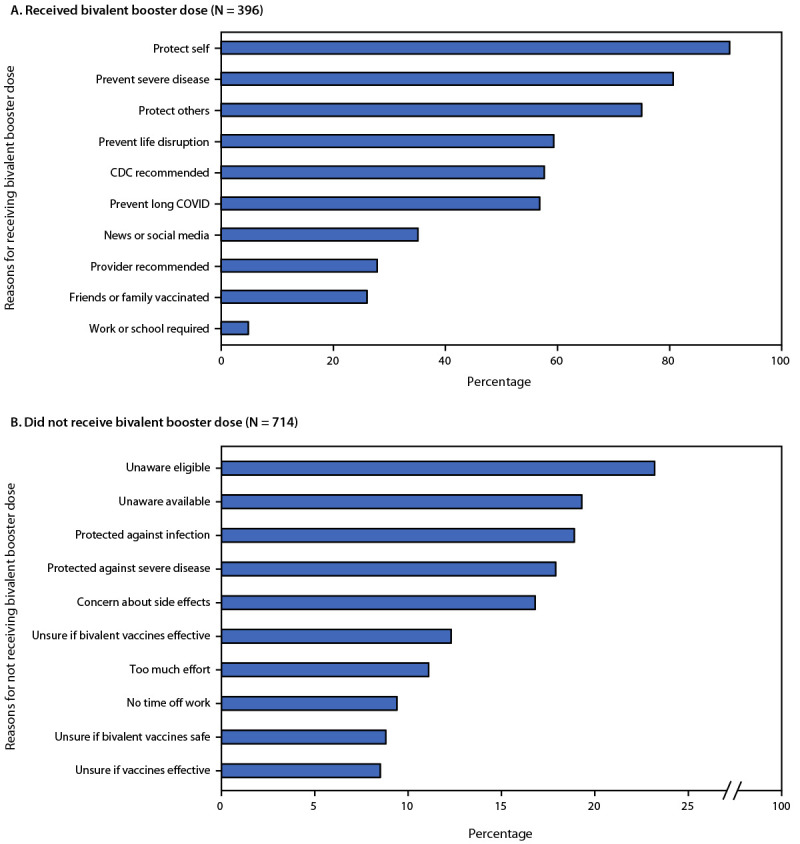
Reasons for receiving (A) or not receiving (B) a bivalent COVID-19 booster dose, among persons who did and did not receive it — United States, November–December 2022
Official websites use .gov
A
.gov website belongs to an official
government organization in the United States.
Secure .gov websites use HTTPS
A lock (
) or https:// means you've safely
connected to the .gov website. Share sensitive
information only on official, secure websites.
Reasons for receiving (A) or not receiving (B) a bivalent COVID-19 booster dose, among persons who did and did not receive it — United States, November–December 2022