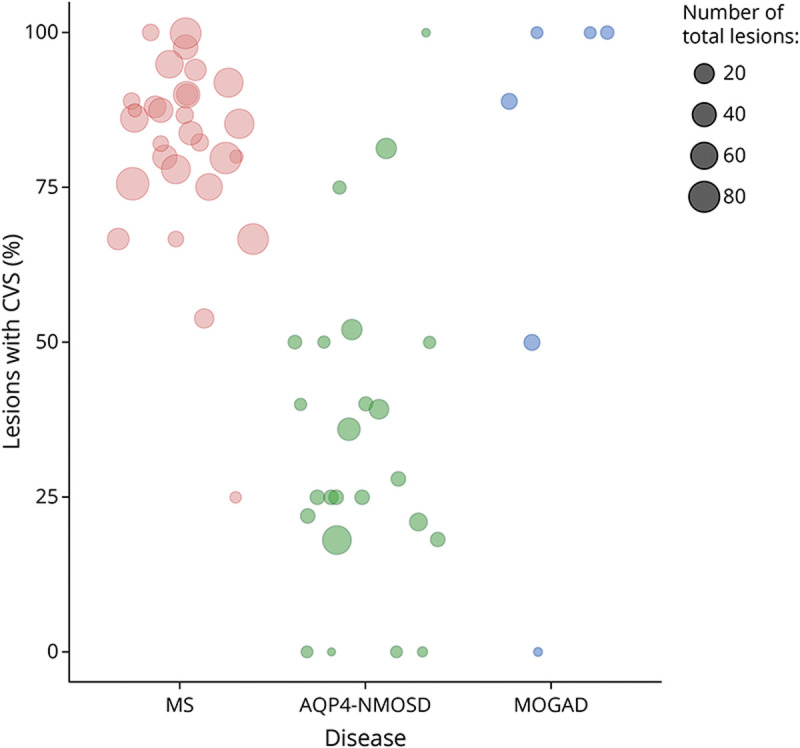
Figure 3. Central Vein Sign (CVS) Detected on Susceptibility-Weighted Imaging (SWI) in the Patient Groups.

The scatterplot shows the proportion of lesions with CVS (out of the total number of lesions) for each patient in the 3 diseases (orange = RRMS, green = AQP4-NMOSD, and blue = MOGAD). Patients without brain lesions are not displayed. Two of 8 patients with MOGAD were excluded from the rating (1 for poor SWI quality and 1 for extensive, confluent PD/T2 abnormalities). Note: 100% means that all lesions assessed showed the CVS. MOGAD = myelin oligodendrocyte glycoprotein antibody–associated disease; RRMS = relapsing-remitting multiple sclerosis.
